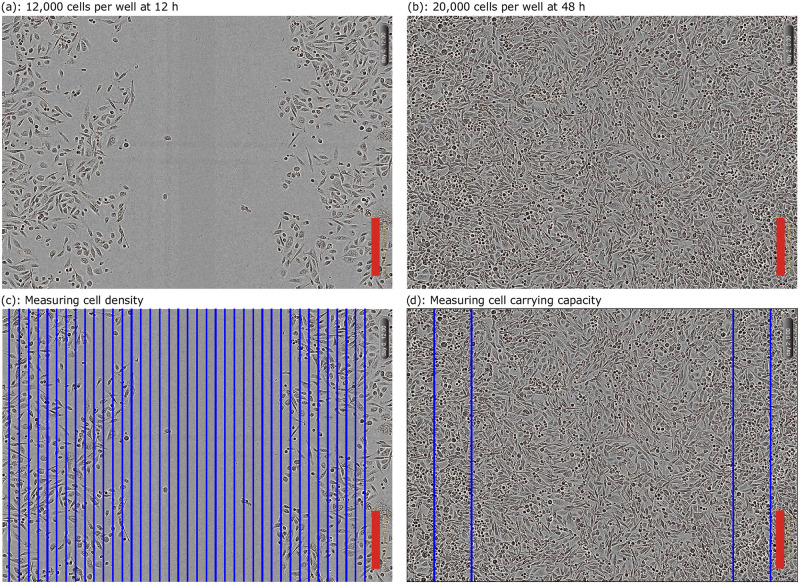
Fig 2. Measuring cell density cell carrying capacity.
(a) and (b) are two images from the experiment of Jin et al. [13] with the initial CPW and times shown. The red scale bar corresponds to 300 μm. (c) Illustration of how the images are split into columns, shown in blue, with cells counted for each column to measure the cell densities. (d) The carrying capacity density is measured by counting the number of cells for the 20,000 CPW data set at t = 48 h in the blue rectangles shown, divided by the area of these regions.

