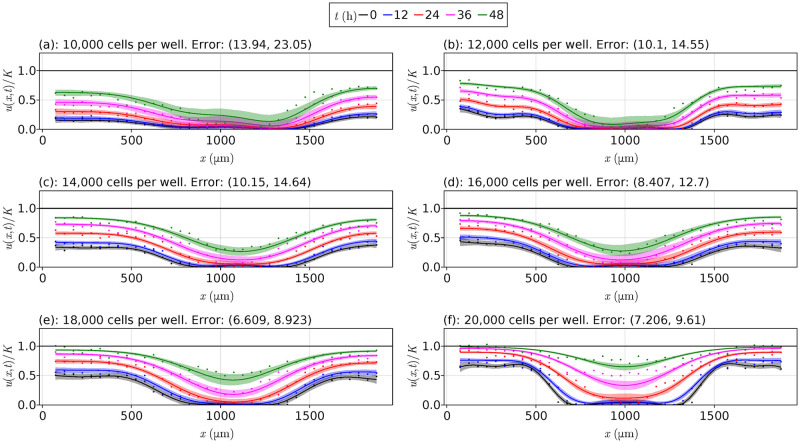
Fig 6. Optimal results for each data set.
PDE solutions for each data set from Jin et al. [13] for the delayed Fisher-Kolmogorov model (3) from Table 1, with the vertical axis giving u/K rather than u, where K = 1.7 × 10⁻³ cells μm−2. The points show the data from Jin et al. [13], the solid lines show the mean solution at each corresponding time, and the shaded regions around these lines give the 95% confidence intervals for each solution. Initial conditions are obtained from sampling the Gaussian process rather than using splines. The black horizontal line is at u/K = 1.

