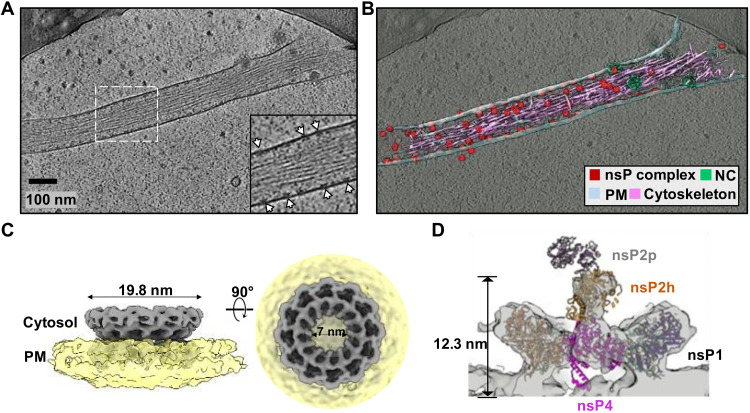
Fig. 4. Inactive nsP complex induced membrane protrusion revealed by cryoET.
(A) Tomographic slice of cell periphery depicting a filopodia-like membrane protrusion structure extended from the PM. White arrows point to the membrane-associated nsP complexes. Scale bar, 100 nm. (B) Corresponding 3D segmentation of cellular features. See also movie S2. (C) CHIKV nsP complex 3D volume determined by subtomogram averaging with imposed C12 symmetry. (D) The RC core complex (nsP1 + 2 + 4) is fitted into the C1 subtomogram average map of the nsP complex. Note that the cytoplasmic ring as observed in Fig. 3C is absent in this inactive nsP complex. Consequently, there is no density observed for the C-terminal protease of nsP2.

