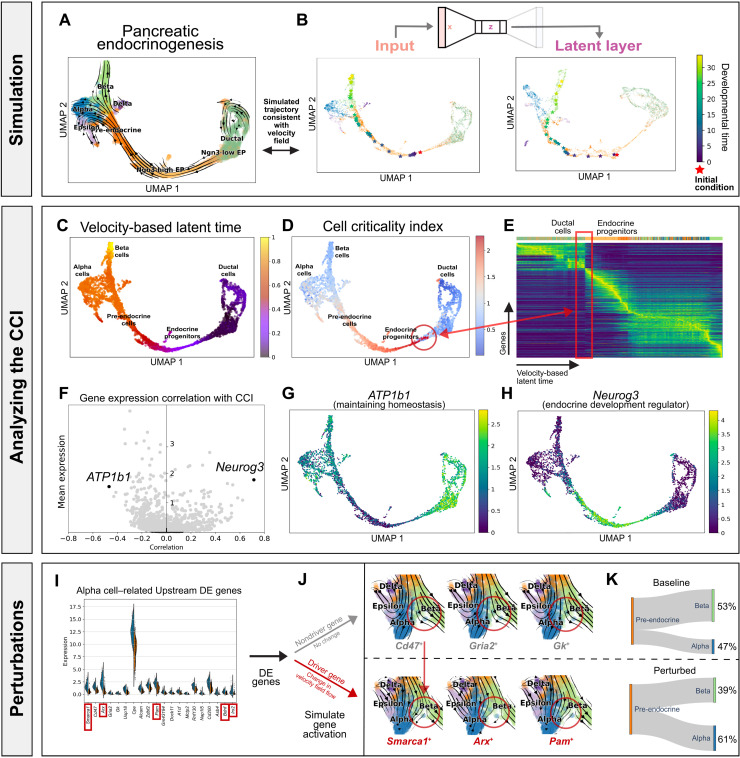
Fig. 2. Pancreatic endocrinogenesis as a dynamical system.
(A) Pancreatic endocrinogenesis phase portraits projected in a low-dimensional embedding. Here, each cell is represented by a gene expression state and an RNA velocity vector. (B) Simulating the developmental trajectory (in viridis) of an out-of-sample cell (in red) forward in time, visualized in a uniform manifold approximation and projection (UMAP) embedding of the gene expression state (x), autoencoder latent layer (z). (C) Velocity-based latent time derived from the RNA velocity for each cell. (D) The CCI derived from DeepVelo for each cell. (E) Gene expression of cells ordered by the velocity-derived latent time. Here, the CCI reveals unstable cell states indicative of fate commitment with a broad shift in gene expression patterns in latent time. (F) Genes that highly correlate with the CCI reveal driving forces behind endocrine progenitor dynamics. (G) In particular, ATP1b1, which negatively correlates with the CCI, has an important function in maintaining homeostasis in stable and stationary cell types. (H) Neurog3, which positively correlates with the CCI, is a known pre-endocrine master regulator. These genes support the CCI as a metric for the stability of single-cell states. (I) Differential gene expression analysis of pre-endocrine cells reveals key putative genes that correlate with the fate of transforming into an alpha versus a beta cell. (J) Visualizing the velocity field of perturbed cell states with activation in alpha cell–related driver genes versus nondriver genes. The red circles highlight differences in the velocity field. (K) Early perturbation of driver genes, which are a subset of DE genes, associated with an alpha cell fate resulted in a higher proportion of alpha cells from the pre-endocrine cells, suggesting a causal relationship through in silico studies.

