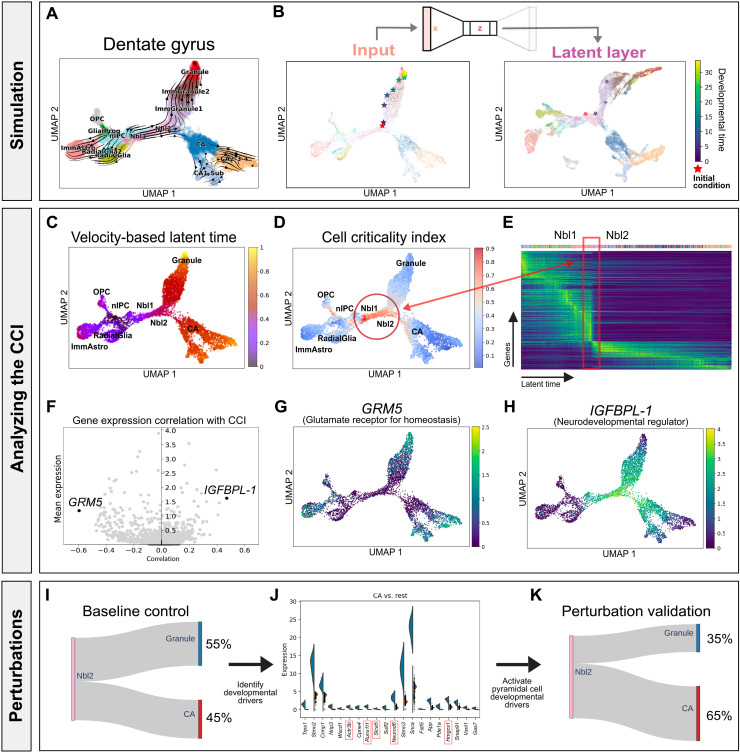
Fig. 3. Developing mouse dentate gyrus as a dynamical system.
(A) Dentate gyrus phase portraits projected in a low-dimensional embedding. Each cell is represented by a gene expression state vector and an RNA velocity vector. (B) Simulating the developmental trajectory (in viridis) of an out-of-sample cell (in red) forward in developmental time, visualized in UMAP embeddings. (C) Velocity-based latent time derived from scVelo for each cell. (D) CCI derived from DeepVelo for each cell. (E) The CCI reveals instability during the transition from Nbl1 to Nbl2 cells, indicative of cell fate commitment. (F) Genes that highly correlate with the CCI reveal driving forces behind the dentate gyrus dynamics. (G) In particular, GRM5, which shows the strongest negative correlation with the CCI, encodes glutamate receptors in stable and stationary neurons. (H) IGFBPL-1, which shows the strongest positive correlation with the CCI, regulates neurodevelopment. (I) Baseline proportion of terminal cell types that result from Nbl2 cells. (J) Differential gene expression analysis of Nbl2 cells reveals key putative genes that correlate with the fate of transforming into a pyramidal versus granule cell. Early perturbation of each top DE genes associated with a pyramidal cell fate can result in a statistically significant (highlighted in red) higher proportion of pyramidal cells, suggesting a causal relationship through in silico studies. (K) Average terminal cell ratios after in silico perturbations.

