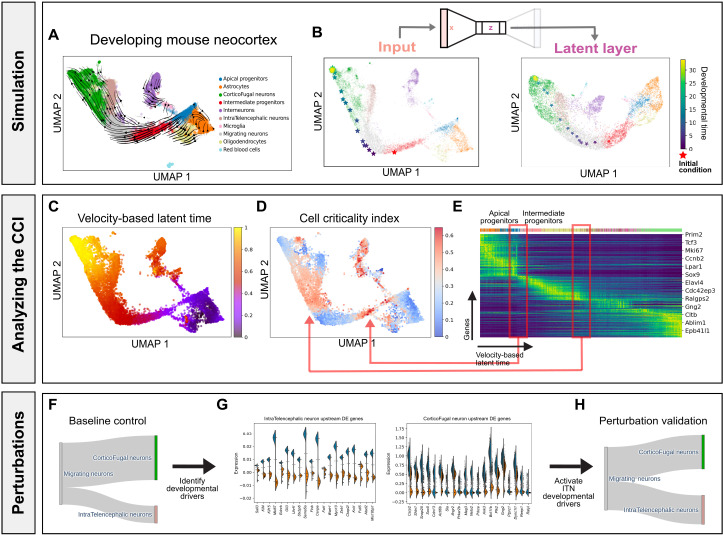
Fig. 4. Developing mouse neocortex over multiple embryonic days.
(A) Mouse neocortex phase portraits projected in a low-dimensional embedding. (B) Simulating the trajectory (in viridis) of an out-of-sample cell (in red) forward in developmental time, visualized in gene expression embeddings and VAE latent layer embeddings. (C) Velocity-based latent time derived from scVelo. (D) The CCI reveals two unstable fixed points indicative of a biphasic fate-commitment dynamic. (E) One latent time point highlights the transition from APs to IPs, and the other highlights the transition from MNs to CFNs. (F) Baseline proportion of terminal cell types from MNs. (G) Differential gene expression analysis of the simulated MNs reveals key putative genes that correlate with the fate of transforming into an ITN versus CFN. (H) Early perturbation of the top DE genes associated with a pyramidal cell fate resulted in an average 10% higher proportion of ITNs from the perturbed MNs.

