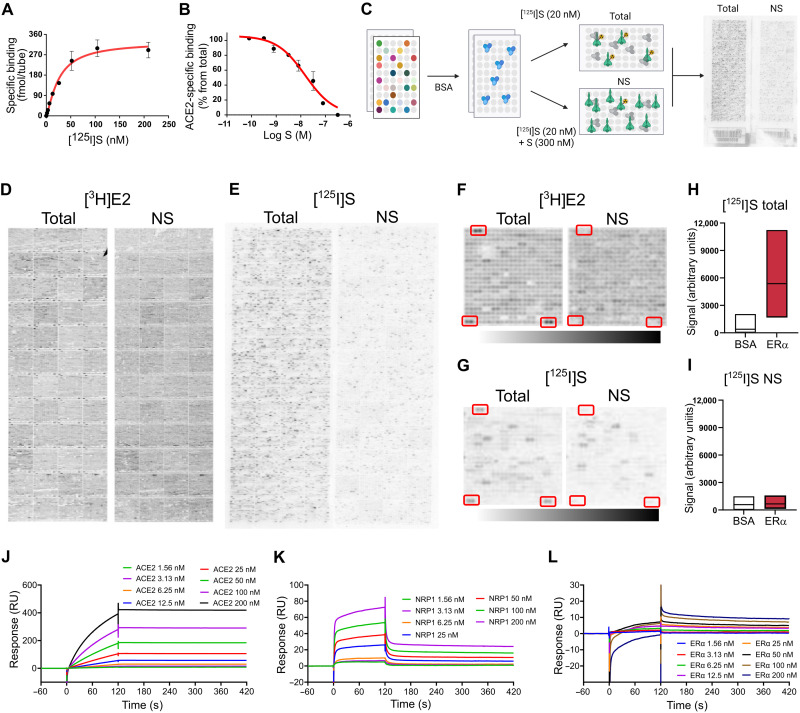
Fig. 1. S binds ERα with high affinity.
(A) [125I]S saturation and (B) competition binding to recombinant ACE2. (C) Schematic of ProtoArray experimental design. (D) Positive control ProtoArray autoradiograms showing total and nonspecific (NS) binding of [3H]E2. (E) ProtoArray autoradiograms (experiment 1 of 3) showing total and nonspecific binding of [125I]S. (F and G) Representative array blocks showing total and nonspecific [3H]E2 and [125I]S binding. Red rectangles show location of ERα proteins. (H and I) Quantification of total and nonspecific [125I]S binding at ERα and bovine serum albumin (BSA) (control). Data are representative of three independent experiments. (J to L) Representative SPR sensorgrams showing kinetic and equilibrium binding analyses of immobilized S exposed to increasing concentrations of ACE2, NRP1, and ERα protein (Kon = 2.03 × 10⁵, Koff = 1.96 × 10⁻³, and KD = 9.7 nM). In (A) and (B), data are represented as means ± SEM. In (H) and (I), data are presented as median ± min and max limits.

