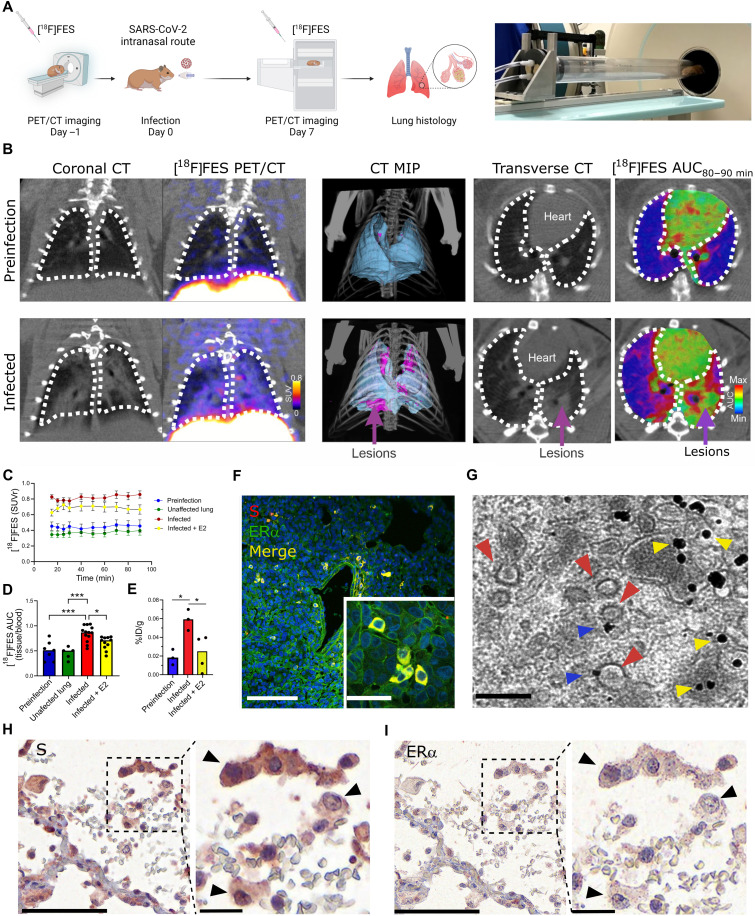
Fig. 4. SARS-CoV-2 infection increases cytoplasmic ERα accumulation and S-ERα colocalization in pulmonary macrophages.
(A) Schematic showing experimental design of SARS-CoV-2 hamster studies and BSL-3 imaging compartment (Created with BioRender). (B) CT, [18F]FES PET, and area under the curve (AUC) heatmap overlay images from hamsters at preinfection (day −1) and infection (day 7). MIP, maximum intensity projection. (C) Time activity curves showing standard uptake value ratio (SUVr; tissue/blood [18F]FES content) in each experimental group. n = 4 to 5 per group. ***P < 0.001 versus preinfection (D) [18F]FES uptake expressed as area under the curve ratio (AUCr; tissue/blood [18F]FES content). F(3,32) = 12.15, ***P < 0.001 and *P < 0.05. (E) [18F]FES uptake expressed as % injected dose (%ID)/gram of body weight in postmortem hamster lung (harvested 110 min after injection; n = 3 to 4 per group). F(2,7) = 7.161, *P < 0.05. (F) Hamster lung IHC showing colocalization of S and ERα immunoreactivity (experiment 1 of 2). (G) Immunogold electron microscopy showing SARS-CoV-2 particles (red arrowheads) and ERα-bound gold nanoparticles (blue arrowheads) in a hamster alveolar macrophage. Scale bars, 200 nm. Yellow arrowheads correspond to cytoplasmic ERα accumulation. (H) S and (I) ERα immunostaining in SARS-CoV-2–infected human lung showing S-ERα colocalization in macrophages (black arrowheads). Scale bars, 100 nm (low mag) and 25 nm (high mag). All data are shown as means ± SEM.

