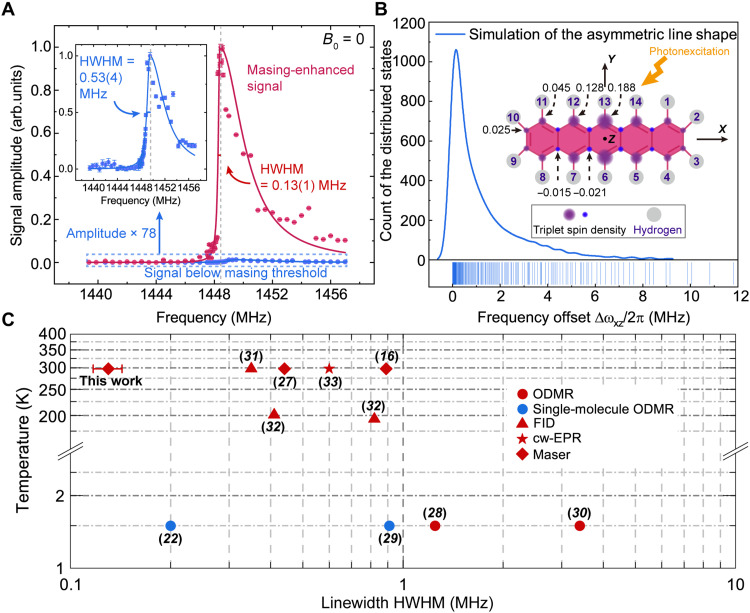
Fig. 3. Masing effects on the line shape of pentacene’s ∣X⟩ ↔ ∣Z⟩ transition at zero field.
(A) Comparison of the line shapes obtained below (blue) and above (red) the masing threshold. The measured signal amplitudes (dots) with the error bars denoting SEs of the amplitudes are plotted as a function of frequency and fitted with a bi-Lorentzian function (solid lines). The fitted HWHM of the low frequency component of each line shape is labeled. The dashed gray lines indicate the peak positions. Inset: Zoomed-in view of the below-threshold line shape with a 78-fold magnification in its amplitude. (B) Simulated asymmetric line shape of ∣X⟩ ↔ ∣Z⟩ transition at zero field. Frequency offsets of the 214 substates arising from the second-order HFIs are calculated and plotted in a kernel density curve with rug. The number of bins is 1000. Inset: The molecular structure of pentacene with the 14 protons (gray circles) labeled. The values of triplet spin densities (purple and blue circles) (57) at different carbon nuclei are partially labeled according to the molecular symmetry. (C) Comparison of the low-frequency side HWHM of zero-field ∣X⟩ ↔ ∣Z⟩ transition line shape measured in different studies. All low-temperature results (22, 28–30) are obtained using optically detected magnetic resonance (ODMR). The free-induction decay (FID) (31, 32), continuous-wave electron paramagnetic resonance (cw-EPR) (33), and masers (16, 27) are used to measure the HWHM at the higher temperatures (≥194 K). Blue, single molecular spin; red, spin ensemble.

