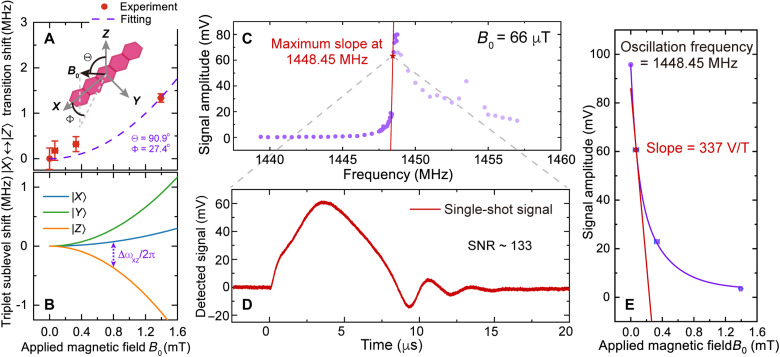
Fig. 4. Magnetometer performance.
(A) Zeeman effect–induced resonance shifts of pentacene’s ∣X⟩↔∣Z⟩ transition measured under various applied magnetic fields B0. The alignment of the magnetic field B0 with respect to pentacene molecular Z and X axes is fitted to be Θ = 90.9° and Φ = 27.4°. (B) Calculated energy shift of each pentacene triplet sublevel when a variable magnetic field B0 is applied with Θ = 90.9° and Φ = 27.4°. The shift of ∣X⟩↔∣Z⟩ transition frequency associated with (A) is labeled. (C) Signals of the ∣X⟩↔∣Z⟩ transition measured with above-threshold pumping at B0 = 66 μT. The signals are plotted as a function of frequency (purple dots), in which the steepest rise in signal amplitude, i.e., the maximum slope is determined at 1448.45 MHz (red star). (D) A single-shot time-domain signal with SNR of 133 obtained at 1448.45 MHz. (E) Magnetic field dependence of the signal amplitude measured at 1448.45 MHz. The data are fitted with an exponential curve (purple) with a tangent line used to estimate the slope at B0 = 66 μT.

