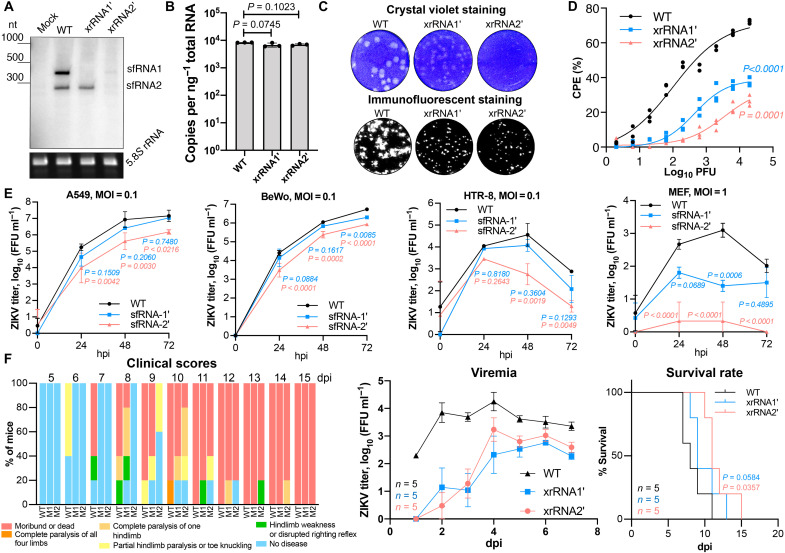
Fig. 1. ZIKV sfRNA facilitates viral replication, cytotoxicity, and pathogenesis in the mammalian host.
(A) Northern blotting showing the production of ZIKV sfRNA in Vero cells infected with WT, xrRNA1′, and xrRNA2′ ZIKV. Bottom displays ribosomal RNA (rRNA) visualized by ethidium brimide staining as a loading control. nt, nucleotide. (B) The quantitative reverse transcription polymerase chain reaction (qRT-PCR) quantification of viral RNA in samples used in (A). (C) ZIKV plaque morphology on a monolayer of Vero cells at 72 hours postinfection (hpi). Bottom: Virus replication foci visualized by immunostaining of Vero cells inoculated with the same virus samples. (D) Cytotoxicity of WT and sfRNA-deficient ZIKV mutants determined using Viral ToxGlo Assay. Vero cells were infected at the indicated multiplicities of infection (MOIs), and CPE was measured at 72 hpi. % CPE is calculated with reference to uninfected cells. (E) Viral growth kinetics in human lung (A549), human placental (BeWo and HTR-8), and mouse embryonic fibroblast (MEF) cells infected at MOI = 0.1. (F) Replication of WT and sfRNA-deficient ZIKV in AG129 mice inoculated with 104 focus-forming units (FFU) per mouse. Animals were monitored for disease symptoms for 15 days, and blood was collected daily via tail bleeding. Images in (A) and (C) are representative of three independent experiments. Values in (B), (E), and (F) (viremia) are the means from three biological replicates ± SD. Statistical analysis is by Student’s t test in (B), regression analyses in (D) with the P values indicating the differences in means, one-way analysis of variance (ANOVA) in (E), area under the curve method for viremia in (F), and Gehan-Breslow-Wilcoxon test for survival rates in (F). Titers in (E) and (F) were determined by a foci-forming immunoassay of C6/36 cells. dpi, days postinfection.

