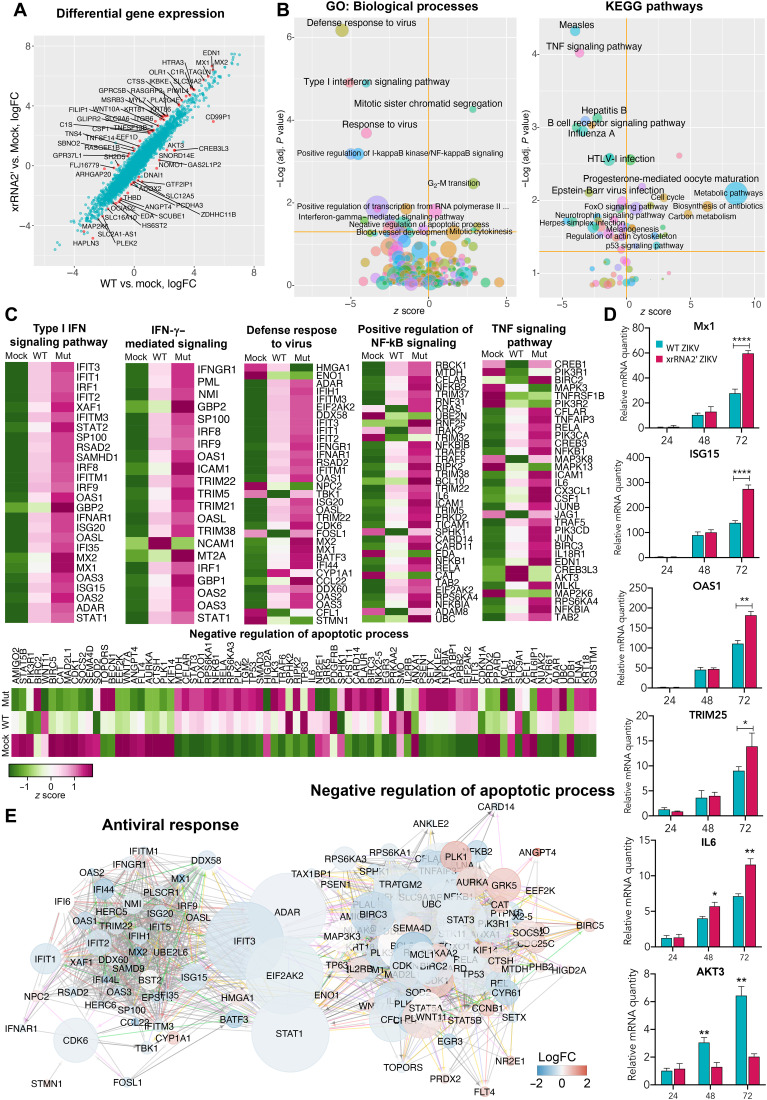
Fig. 5. Effect of sfRNA production on expression of host genes in infected human placental cells.
(A) Differential gene expression in BeWo cells infected with WT and xrRNA2′ ZIKV. Red dots show genes that responded differently to infection with WT and mutant viruses (false discovery rate–adjusted P < 0.05). LogFC, log fold change. (B) Pathways and biological processes affected by the production of ZIKV sfRNA for genes identified in (A). (C) Expression of genes associated with biological processes affected by the production of sfRNA in BeWo cells. Values are z scores and are the means from three biological replicates. (D) Expression of selected ISGs and apoptosis-regulating genes in BeWo cells infected with MOI = 1 of WT (magenta bars) and xrRNA2′ (cyan bars) ZIKV and determined by qRT-PCR. Relative mRNA quantity was determined using the ΔΔCt method and is relative to mock with normalization to GAPDH. Values are the means ± SD, n = 3. Statistical analysis is by t test. (E) Network of interactions between the sfRNA-affected genes involved in antiviral response and apoptosis. Two individual networks were reconstructed from the genes identified in (C) using the GeneMANIA Cytoscape plug-in and then merged. The resulting network was subjected to Cytoscape network analysis to calculate the betweenness centrality values as a measure for the weight of each node in the combined network. Size of the nodes indicates betweenness centrality, and the color of the nodes indicates the difference in gene expression between the cells infected with WT and xrRNA2′ mutant ZIKV. Positions of the nodes are relative to their connectivity within and between the two subnetworks. *P < 0.05, **P < 0.01, ***P < 0.001, ****P < 0.0001.

