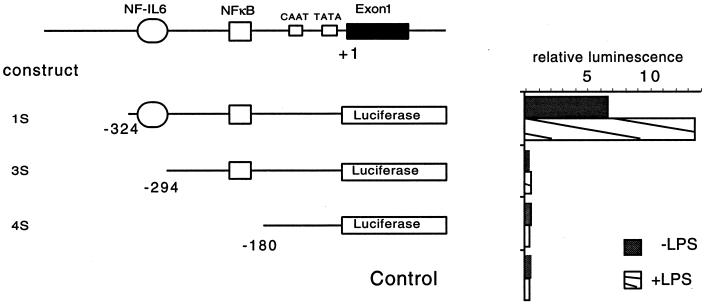
FIG. 2.
Promoter analysis of the upstream region of the TAP gene. A map of the putative promoter region of the TAP gene is shown at the top. Segments of the 5′ flanking region of the TAP gene were ligated into a promoterless luciferase reporter expression vector. Plasmid constructs containing the putative NF-κB and NF IL-6 sites are shown to the left, along with the control vector containing no promoter. Plasmid constructs were transfected into cultured primary TEC, followed by stimulation with LPS. The promoter activity for each plasmid is exhibited as relative luminescence of each transfection, normalized to cotransfected β-galactosidase, and is shown to the right of the respective plasmid.

