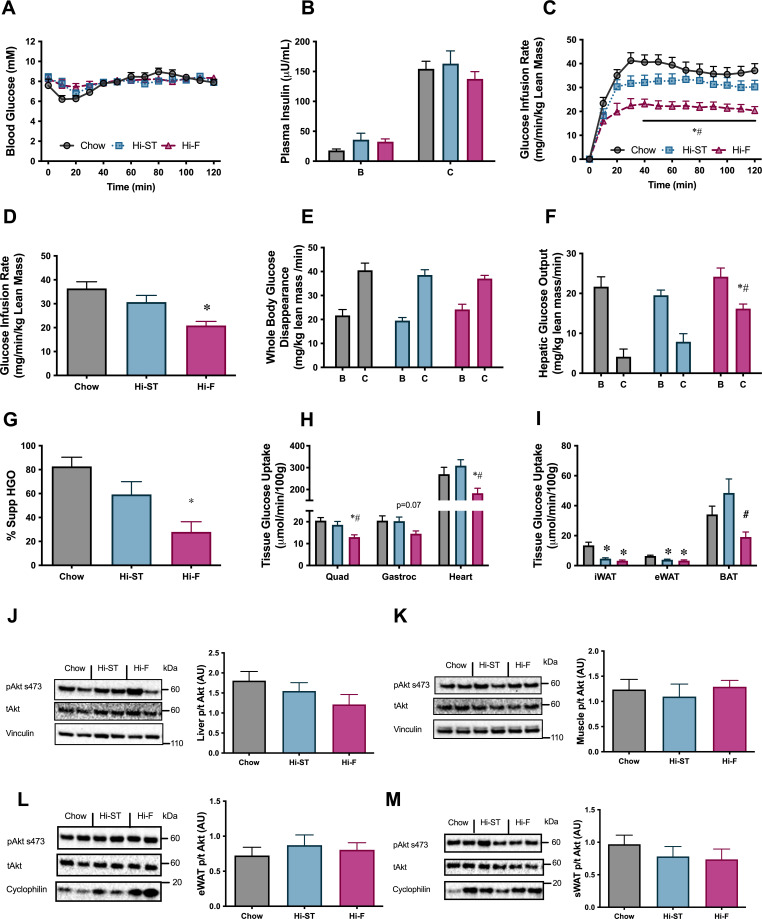
Figure 3. Euglycaemic-hyperinsulinaemic clamp parameters show preservation of whole body, liver and skeletal muscle insulin resistance.
(A) Blood glucose, (B) plasma insulin, (C) glucose infusion rate, (D) average glucose infusion rate of 90–120 min, (E) whole body glucose disappearance, (F) hepatic glucose output (HGO), (G) percent suppression of HGO, (H) muscle glucose uptake, (I) adipose tissue glucose uptake, (J) phosphorylation of Akt in liver after the clamp, (K) phosphorylation of Akt in quadriceps muscle after the clamp, (L) phosphorylation of Akt in epididymal white adipose tissue (eWAT) after the clamp, (M) phosphorylation of Akt in subcutaneous white adipose tissue (sWAT) after the clamp. B, basal state; C, clamped state. Grey – chow, blue – high starch (Hi-ST), pink – high fat (Hi-F). Data presented as mean ± SEM. Data analysed with a one-way ANOVA or two-way repeated measures ANOVA where appropriate. n=8–11. *p<0.05 different to chow; #p<0.05 different to Hi-ST.

