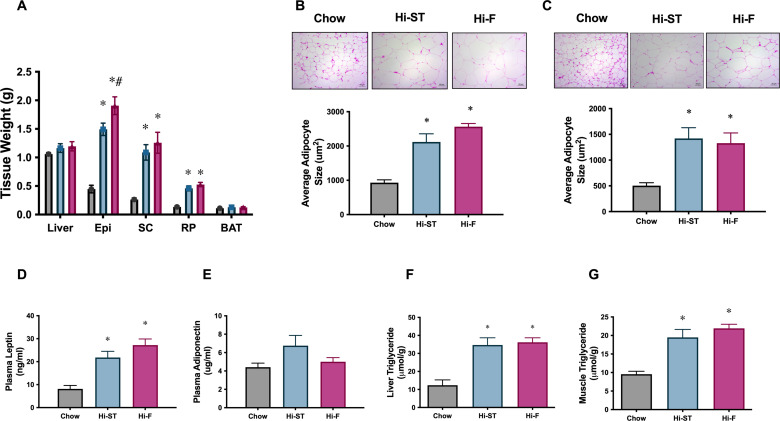
Figure 4. Adipose tissue weights, and adipocyte size, were increased to a similar extent in high starch (Hi-ST) and high fat (Hi-F) as were plasma leptin and the level of triglycerides in liver and muscle.
(A) Tissue weights, n=9–11, (B) average adipocyte size in epididymal white adipose tissue (WAT), (C) average adipocyte size in subcutaneous WAT, n=3–5, plasma levels of (D) leptin and (E) adiponectin, n=10–11. (F) Liver triglyceride levels, n=5–8, (G) quadriceps muscle triglyceride levels, n=9–12. Grey – chow, blue – Hi-ST, pink – Hi-F. Data presented as mean ± SEM. Data analysed with a one-way ANOVA. *p<0.05 different to chow; #p<0.05 different to Hi-ST.

