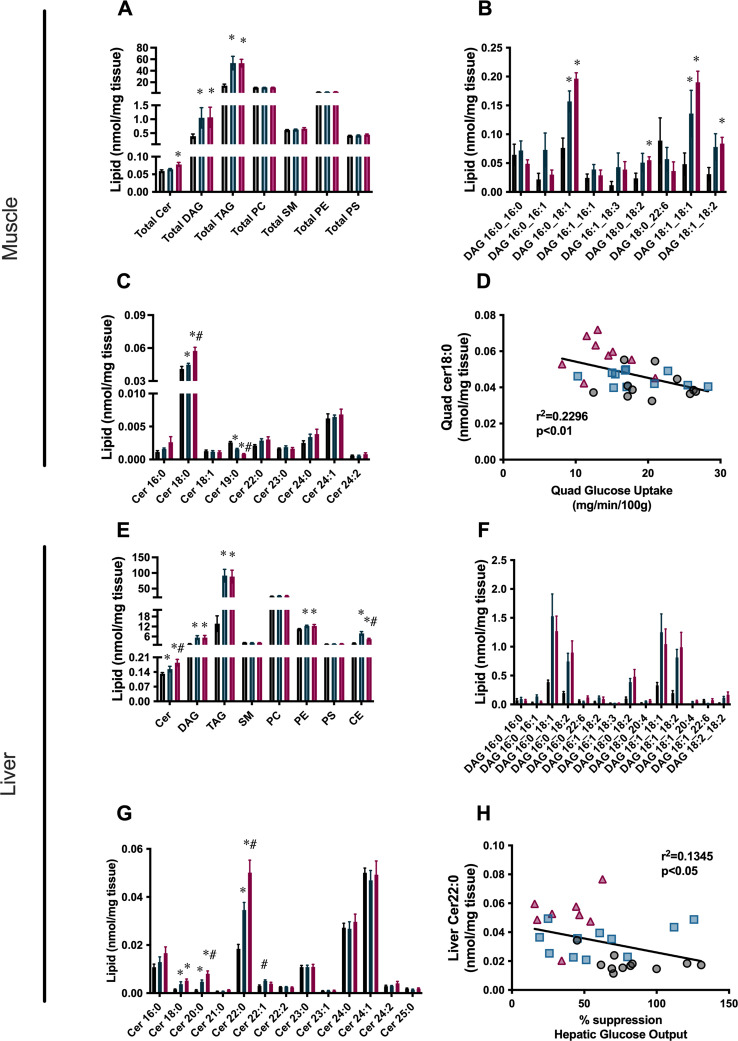
Figure 6. Reduction in total ceramide levels, as well as specific ceramide species that are correlated with insulin sensitivity, is found in the liver and quadriceps muscle of high starch (Hi-ST) fed mice.
(A) Total lipid levels, (B) diacylglycerol (DAG) species, (C) ceramide species, and (D) the relationship between insulin sensitivity and Cer18:0 levels in muscle. (E) Total lipid levels, (F) DAG species, (G) ceramide species, and (H) the relationship between insulin sensitivity and Cer22:0 levels in liver. Grey – chow, blue – Hi-ST, pink – high fat (Hi-F). Data presented as mean ± SEM. Data analysed with a Kruskal-Wallis test with pairwise Wilcoxon rank sum used for post hoc comparisons. Data were corrected for false discovery rate using the method of Benjamini-Hochberg. n=8–11. *p<0.05 different to chow; #p<0.05 different to Hi-ST.


