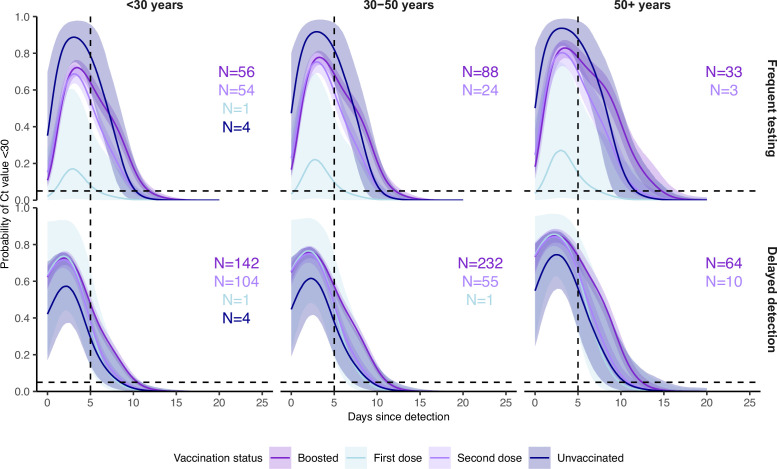
Appendix 1—figure 12. Proportion of Omicron BA.1 infections with Ct <30 on each day post detection stratified by vaccination status, age group and detection group.
Solid colored lines and shaded ribbons are posterior estimates from a generalized linear model predicting probability of Ct <30 as a function of days since detection, vaccination status and variant, showing the posterior mean (solid line) and 95% credible intervals (shaded ribbon) of each conditional effect. Note that only Omicron BA.1 estimates are shown, though the model included data from Delta and pre-Delta infections. Dashed horizontal and vertical lines show 5% probability and day 5 post detection respectively.

