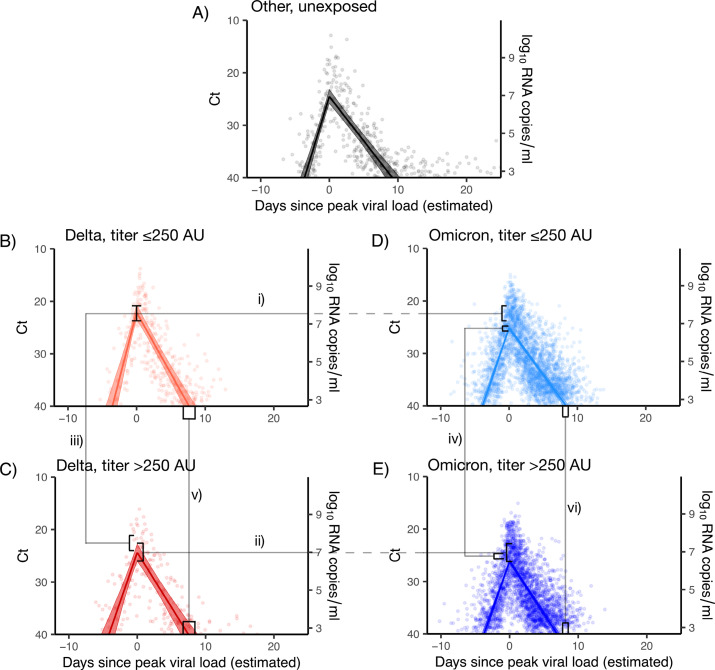
Figure 4. Estimated viral trajectories by variant and titer.
Points depict measured Ct values, lines depict the estimated population mean viral trajectories, and shaded regions depict the 95% credible intervals for the estimated population viral trajectories. (A) Non-Delta and non-Omicron infections in individuals who were previously unexposed (no prior record of vaccination or infection), (B) Delta infections with titer ≤250, (C) Delta infections with titer >250, (D) Omicron BA.1 infections with titer ≤250, (E) Omicron BA.1 infections with titer >250. Peak viral loads were higher for Delta infections than for Omicron BA.1 infections when stratifying by titer (i and ii), and titers ≤250 were associated with higher viral loads when stratifying by variant (iii and iv). Low titers were also associated with longer clearance times (v and vi).

