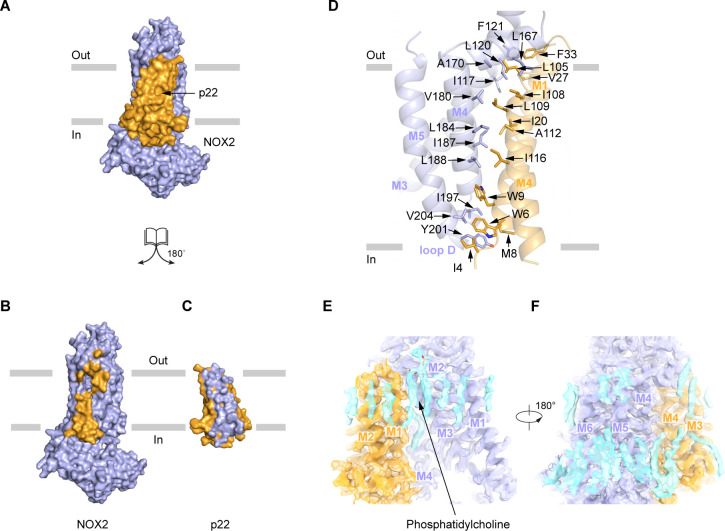
Figure 4. The interaction between NOX2 and p22.
(A–C) The open-book view of the interface between NOX2 and p22 in surface representation. NOX2 and p22 are colored in light blue and orange respectively in (A). Residues on NOX2 interacting with p22 are colored in orange in (B). Residues on p22 interacting with NOX2 are colored in light blue in (C). The phospholipid bilayer is shown as gray layers. (D) The interface between NOX2 and p22 in cartoon representation. Residues participating in the interaction between NOX2 and p22 are shown as sticks. (E) Putative lipids that are close to NOX2-p22 interface. The map is contoured at 5.5 σ. (F) A 180°-rotated view of E.

