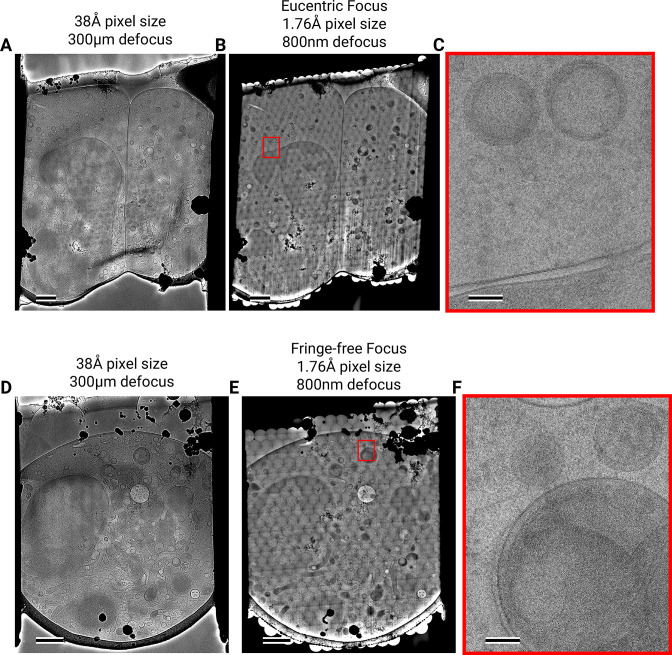
Figure 3. Assembling DeCo-LACE exposures into montages.
(A) Overview image of LamellaEUC 1 taken at low magnification. Scalebar corresponds to 1 μm. (B) Overview of LamellaEUC 1 created by montaging high magnification images taken with the DeCo-LACE approach. Scalebar corresponds to 1 μm. (C) Zoom-in into the red box in panel B. Slight beam-fringe artifacts are visible. Scalebar corresponds to 100 nm. (D) Overview image of LamellaFFF 4 taken at low magnification. Scalebar corresponds to 1 μm. (E) Overview of LamellaFFF 4 created by montaging high magnification images taken with the DeCo-LACE approach. Scalebar corresponds to 1 μm. (F) Zoom-in into the red box in panel E. No beam-fringe artifacts are visible. Scalebar corresponds to 100 nm.

