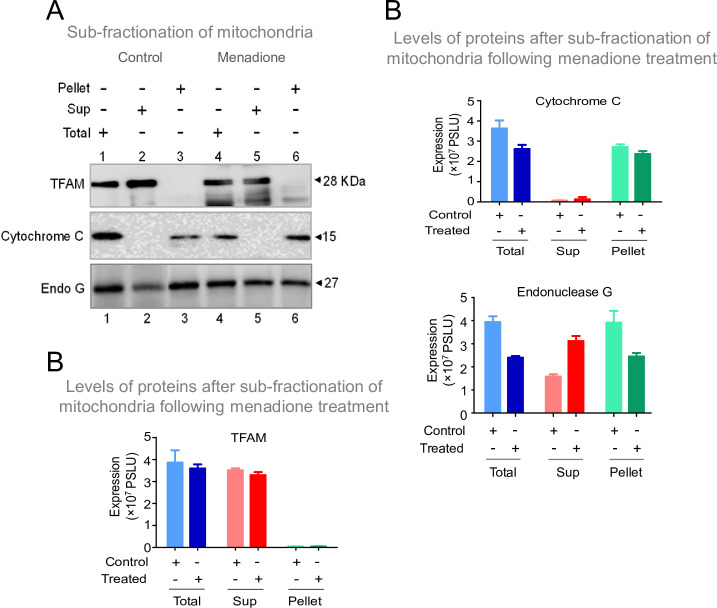
Figure 10. Investigation of stress conditions that favor the transport of Endonuclease G to mitochondrial matrix.
(A) Western blot showing the presence of Endonuclease G, Cytochrome C and TFAM in either total or supernatant (Sup) and pellet fraction with or without menadione treatment (25 µM) following sub-fractionation of mitochondrial compartments. Lanes 1–3 are for control samples and Lanes 4–6 are menadione treated samples. (B) Bar graph showing the quantitation of presence of Endonuclease G, Cytochrome C and TFAM in either total mitochondria or supernatant (Sup) and pellet fraction with or without menadione treatment (25 µM). Quantitation is based on three biological repeats and the data is shown with the error bar calculated as SEM. The values in Y-axis are expressed in PSLU (photo-stimulated luminescence units) representing the expression.

