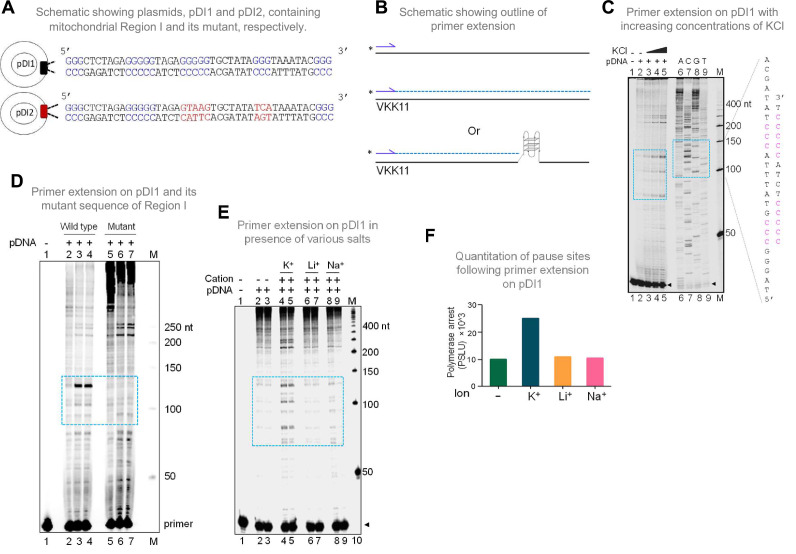
Figure 2. Evaluation of formation of G-quadruplex DNA in Region I of the mitochondrial DNA when cloned into a plasmid.
(A) Schematic showing cloning of the mitochondrial Region I and its mutant to generate plasmids pDI1 and pDI2, respectively. The duplex region containing the G stretches is depicted in blue, while the mutated nucleotides are marked in red. (B) Schematic showing the primer extension across plasmid DNA containing mitochondrial Region I. Positions of primer, VKK11 is indicated. The radiolabeled primer (indicated with an asterisk) binds to one of the strands of the plasmid DNA upon heat denaturation and extends till it encounters a non-B DNA, as it blocks the progression of the polymerase. The products (dotted lines) are then resolved on a denaturing PAGE. (C) The plasmid, pDI1, containing the mitochondrial Region I, was used for primer extension studies using radiolabeled primers for the G-rich (VKK11) in a KCl (25, 50, 100 mM) dependent manner. A sequencing ladder was prepared using VKK11 by the chain termination method of sequencing. Pause sites are shown with dotted rectangles in turquoise. The sequence corresponding to the pause site is boxed, and sequence complementary to G-quadruplex forming motifs are indicated in pink. Sequencing ladder was used as marker. (D) Plasmids, pDI1 and its mutant pDI2, containing mutation in G4 motif, were used for primer extension studies using radiolabelled primer (VKK11). Pause sites are shown with dotted rectangles (turquoise). (E) Evaluation of the effect of different cations (Na+, K+, Li+) on non-B DNA formation at mitochondrial Region I when present on a plasmid (pDI1) by using primer VKK11 in a primer extension assay. The pause sites are indicated in dotted rectangle (turquoise). In panels C-F, ‘M’ denotes the 50 nt ladder. (F) Bar diagram showing the effect of ions in primer extension assay. The values are expressed in PSLU (photo-stimulated luminescence units) representing the extent of pause. Refer also Figure 2—figure supplement 1.


