. 2022 Nov 17;11:e69916. doi: 10.7554/eLife.69916

Figure 4. Evaluation of G-quadruplex structure in mitochondria of cells.

(A) Representative images of HeLa and HEK293T cells showing colocalisation of BG4, the G4 binding antibody to mitochondria following immunofluorescence assay. The nucleus is stained with DAPI (blue colour), mitochondria with MitoTracker DR (red) and BG4 with Alexa-Fluor 488 (green). A merged image is shown with a merge of red and green, as depicted by Coste’s mask (colocalisation is represented as a white dot). (B, C) Quantitation showing colocalisation of BG4 with MitoTracker indicated as dot plots. The colocalisation was quantified using Mander’s colocalisation coefficient (ImageJ software) analysing a minimum of 100 cells as red over green (B) and green over red (C). (D) Representative image of Rho(0) cells showing localization of BG4 to mitochondria following immunofluorescence as investigated in panel (A). (E) Quantitation showing comparison of colocalization of BG4 between HeLa cells and Rho(0) cells shown as dot plots. The colocalization was quantified using Mander’s colocalization coefficient analyzing a minimum of 50 cells as red over green. Refer also Figure 4—figure supplement 1.

Figure 4—source data 1. Localization of BG4 to mitochondria.
Figure 4—source data 2. Immunofluorescence showing the localization of BG4 to mitochondria.

Figure 4.

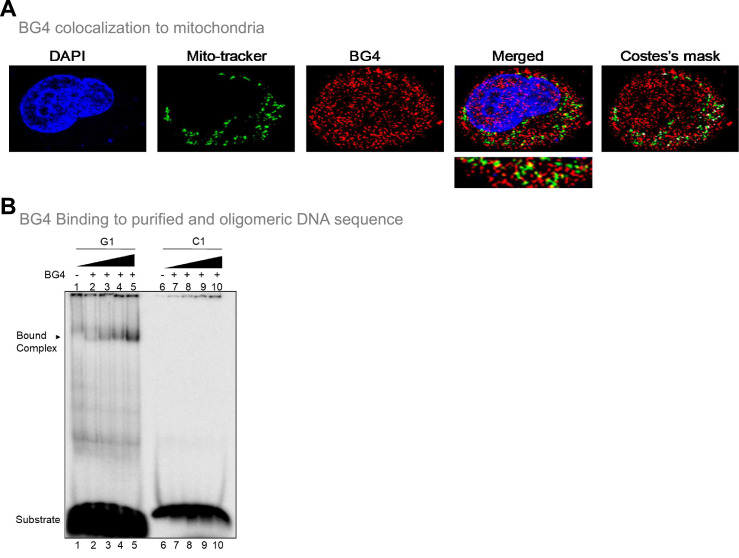
Figure 4—figure supplement 1. Evaluation of existence of G-quadruplex in mitochondria of cells.

Figure 4—figure supplement 1.

Related to Figure 4. (A) Immunofluorescence study showing colocalization of BG4 (antibody that binds to G4 DNA) and mitochondrial genome. Nucleus from HeLa cells is stained with DAPI (blue color). Mitochondria are stained with MitoTracker green FM and G4 DNA with BG4 (Alexa-Fluor 568), a merged image is shown. A merge of red and green is depicted by Coste’s mask (colocalization is represented as a white dot). The experiments were done independently in HeLa and HEK 293T cells and the quantitation of colocalization of BG4 with MitoTracker is shown in Figure 2. (B) Increasing concentrations (0.2, 0.5, 1, and 2 µg) of purified BG4 was incubated with G-rich (G1) and C-rich (C1) oligomers and products were resolved on 5% native polyacrylamide gel. In each case a lane without protein (lane 1 and 6) served as control. The substrate and the bound complex are marked.