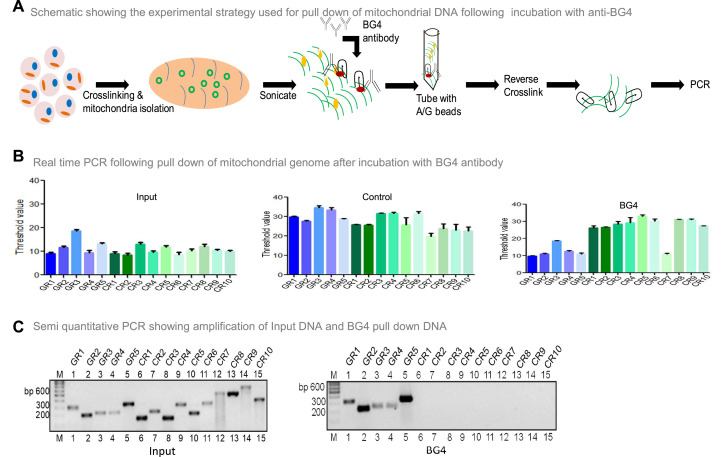
Figure 5. Evaluation of BG4 binding to G-quadruplex structure in mitochondrial genome.
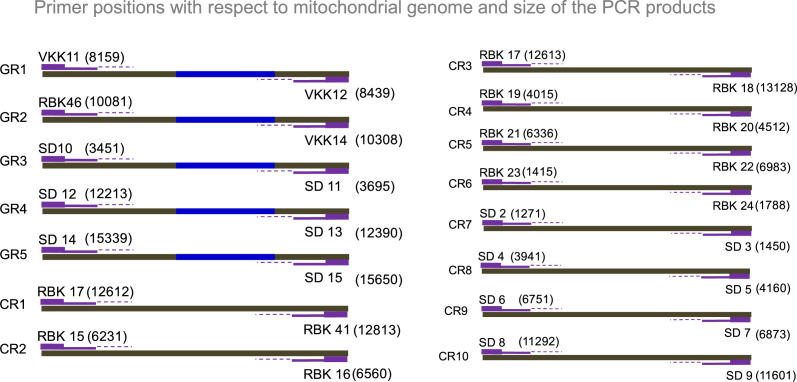
(A) Schematic showing the experimental strategy used for mito-IP using anti-BG4. Briefly, cells were crosslinked and then mitochondria were isolated and sonicated to obtain the small fragments of mitochondrial DNA. Purified BG4 antibody was used along with protein A/G agarose beads to pull down the BG4 bound regions. (B) BG4 bound mtDNA was purified after reverse crosslinking and used for real-time PCR using primers derived from different regions of the mitochondrial genome, which include 5 G-quadruplex forming regions and 10 random regions. Input DNA served as template control. No antibody control was also used. Bars in blue (first 5) are for G-quadruplex forming regions, while green (last 10) are for random regions. Y-axis depicts threshold Ct value obtained following real time PCR for each primer. Error bar represents mean ± SEM. (C) Agarose gel profile showing the amplification of Input DNA (left panel) and BG4 pull down DNA (right panel). ‘M’ denotes 100 bp ladder. Refer also Figure 5—figure supplement 1.


