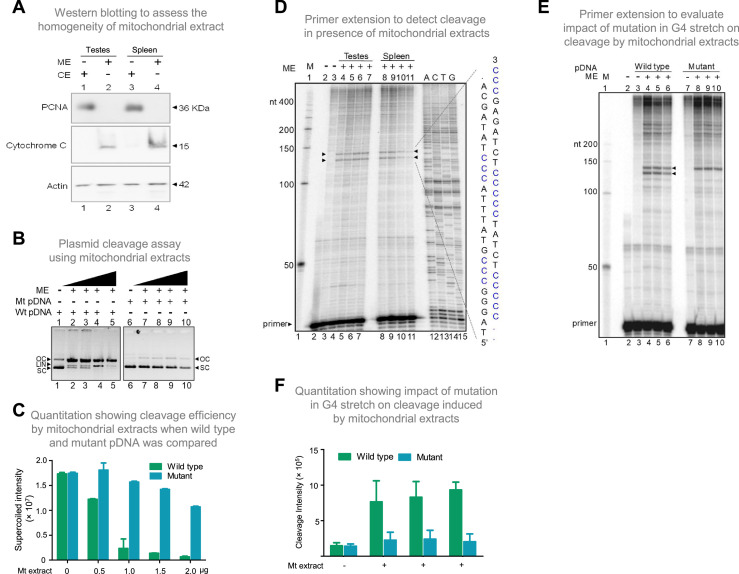
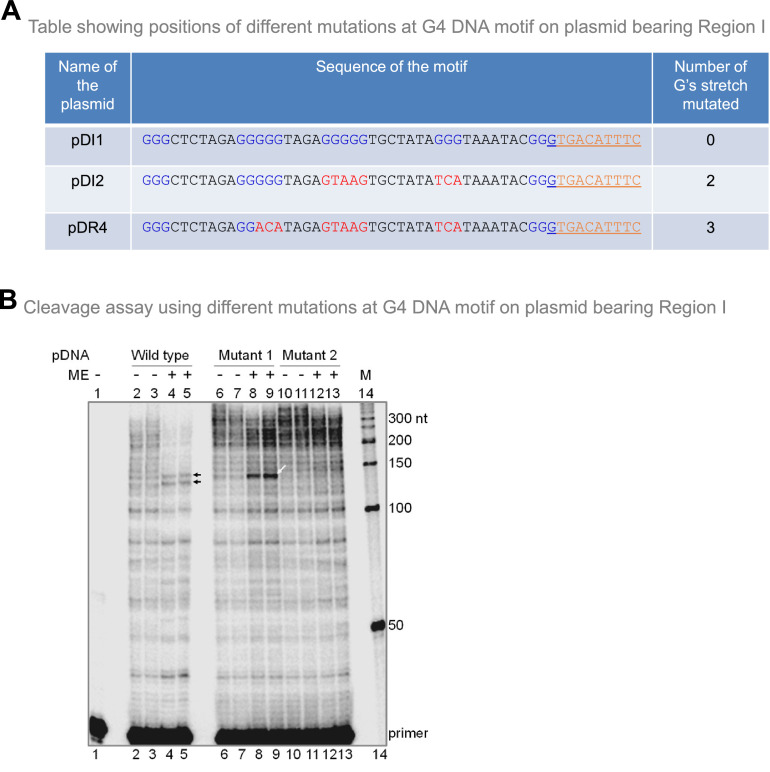
Figure 6. Evaluation of mitochondrial extract induced cleavage at G4 DNA formed at Region I of the mitochondrial genome.
(A) Purification and characterization of mitochondrial extracts. Mitochondrial extract was prepared from rat testis and spleen, and its purity was evaluated using specific markers by western blotting. Purity of CE (cytosolic extract) and ME (mitochondrial extract) were determined using antibodies against PCNA (nuclear and cytoplasmic marker), cytochrome C (mitochondrial marker) and Actin (loading control). (B) In vitro nicking assay on a plasmid containing wild type (WT pDNA) mitochondrial Region I (pDI1) and mutant (Mt pDNA) of Region I (pDI2). Both wild type and mutant plasmids were incubated with mitochondrial extract from rat testes (ME) and resolved on a 0.8% agarose gel. Lanes 1 and 6 served as the control without any extract in the reaction, whereas lanes 2–5 and lanes 7–10 are with increasing concentration (0.25, 0.5, 1, and 2 µg) of mitochondrial extract for pDI1 and pDI2, respectively. ‘OC’ is open circular, ‘LIN’ is linear, and ‘SC’ is supercoiled. (C) Quantification showing the efficiency of mitochondrial extracts (Mt extracts) mediated cleavage when a plasmid containing mutant and wild type G4 motif derived from Region I was compared. The values in Y-axis are expressed in PSLU (photo-stimulated luminescence units) representing the extent of pause. (D) Primer extension assay on plasmid containing mitochondrial Region I (pDI1) to determine the position and location of cleavage. pDI1 was incubated with either mitochondrial extract prepared from testes or spleen in an increasing concentration (0.25, 0.5, 1, and 2 μg), reaction products were purified and used for primer extension assay. Pause sites are indicated, which correspond to G4 DNA motif. Sequencing ladder was used as marker. Complementary sequence corresponding to G-quadruplex forming motif is indicated in blue. ‘M’ is 50 nt ladder. (E) Primer extension assay on pDI1 and pDI2 (G4 mutant) following incubation with mitochondrial extract prepared from rat testis (1 μg). ‘M’ is 50 nt ladder. ‘+’ indicates addition of 1 μg mitochondrial extract shown in triplicates. (F) Quantification showing the cleavage efficiency of mitochondrial extracts (testes) when a plasmid containing mutant and wild type G4 motif derived from Region I was incubated. Cleavage intensity is shown in Y-axis. Error bar represents ± SEM. Refer also Figure 6—figure supplements 1 and 2.


