. 2022 Nov 17;11:e69916. doi: 10.7554/eLife.69916

Figure 9. Investigation of binding efficacy of Endonuclease G to G4 DNA at Region I of mitochondrial genome.

(A) Representative image showing colocalization of Endonuclease G with BG4 in HeLa cells. Alexa Fluor 568 and Alexa Fluor 488 conjugated secondary antibodies were used for detection of Endonuclease G and BG4 proteins, respectively. DAPI was used as nuclear stain. (B) The quantitation showing colocalization of Endonuclease G and BG4. The colocalization was quantified using Mander’s colocalization coefficient (ImageJ software) by analyzing a minimum of 100 cells and presented as a dot plot. Red plot represents the overlapping of Endonuclease G over BG4 while green plot represents the overlapping of BG4 over Endonuclease G. (C) Schematic showing the pull-down assay used for evaluation of binding of Endonuclease G present in the rat testicular mitochondrial extracts to the mitochondrial genome. Bound regions were pulled out using anti-Endonuclease G and protein A/G beads. Regions of interest were detected by either semi-quantitative PCR or real-time PCR using appropriate primers. (D) Agarose gel profile showing the amplification through semi-quantitative PCR of Input DNA (upper panel) and Endonuclease G pull down DNA (lower panel). Primers specific to 5 G-quadruplex forming regions (GR1-GR5) and 10 random regions (CR1-CR10) were also used for the amplification. (E) Real-time PCR of 5 G-quadruplex forming regions (blue) and 10 random regions (green) following pull-down assay. Input DNA served as template control. Antibody control served as a negative control. Error bar represents three independent biological repeats. (F) Evaluation of binding of Endonuclease G to different regions of the mitochondrial genome within cells by mito IP. Cells were crosslinked and then mitochondria were isolated. Endonuclease G bound DNA was obtained and was amplified for different regions of mitochondria, as explained in panel E. Graph is plotted for the Ct values obtained following real-time PCR as described above. The error bar represents three independent biological repeats. Refer also Figure 9—figure supplement 1, Figure 2.

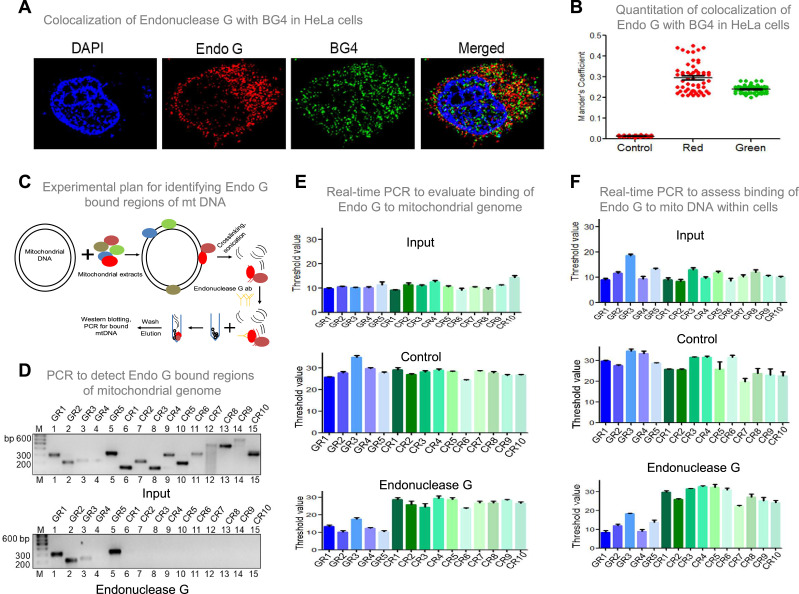
Figure 9—source data 1. ChIP assay showing the binding of Endonuclease G with the mitochondrial G-quadruplex regions within cells.
Figure 9—source data 2. ChIP assay showing the binding of Endonuclease G with the mitochondrial G-quadruplex regions when purified Endonuclease G was used.
Figure 9—source data 3. P1 nuclease assay showing the binding of Endonuclease G to mitochondrial G quadruples regions.

Figure 9.

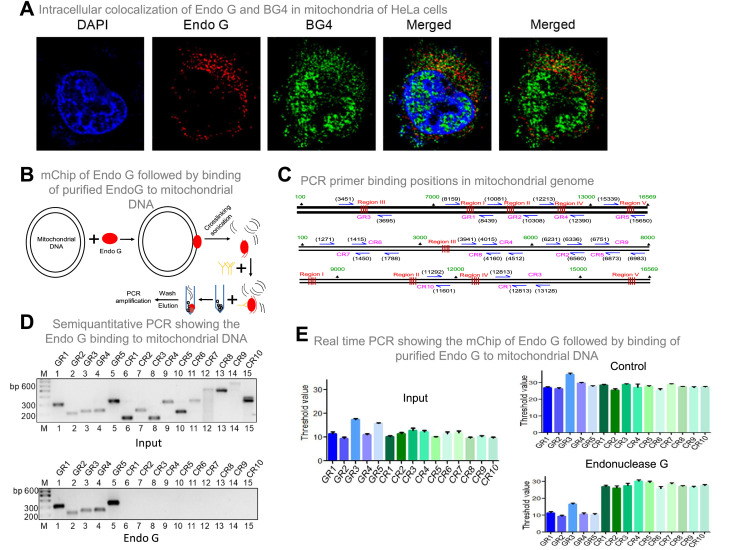
Figure 9—figure supplement 1. Binding of Endonuclease G to G-quadruplex regions of the mitochondrial genome.

Figure 9—figure supplement 1.

Related to Figure 9. (A) Representative immunofluorescence images showing the colocalization of Endonuclease G and BG4. The ‘Merged’ image shown in left is a colocalization of DAPI, Endonuclease G and BG4 foci, while ‘Merged’ in right shows colocalization of Endonuclease and BG4 foci. (B) Schematic showing the binding of purified Endonuclease G to the mitochondrial genome and the pull-down of a bound region using Endonuclease G antibody and protein A/G beads. These regions were then used for semi-quantitative and real-time PCR using appropriate primers. (C) Schematic showing the position of primers used for mito-IP studies. The upper panel shows the primer positions for G-quadruplex forming regions and lower panels for control regions. (D) 5 G-quadruplex forming regions and 10 random regions were used for amplification using mito-IP DNA as template (lower panel). Upper panel shows the amplification for input DNA. (E) Bar graph was plotted for the threshold cycle against different primers following real-time PCR. Input DNA served as template control. ‘Antibody’ control in which no antibody was added served as negative control. Blue bars represent G-quadruplex regions, while green bars represent the control regions. Error bar represents three independent biological repeats.
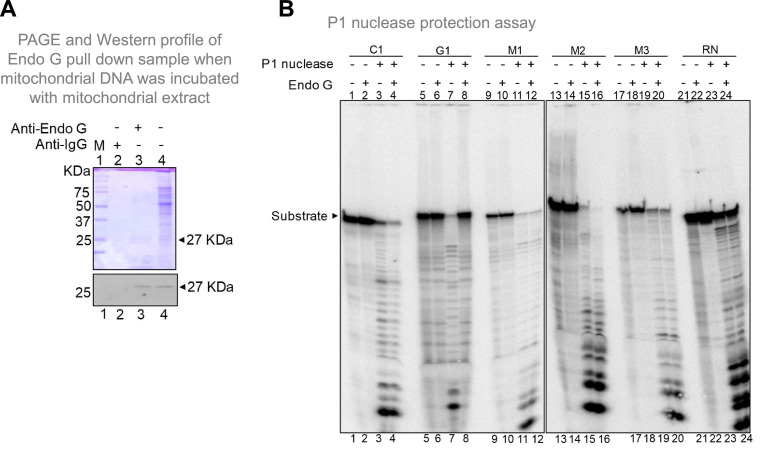
Figure 9—figure supplement 2. Binding of Endonuclease G to G-quadruplex regions of the mitochondrial genome.

Figure 9—figure supplement 2.

Related to Figure 9. (A) SDS profile and western blotting of the pulldown sample when mitochondrial DNA was incubated with mitochondrial extracts. As described in the methodology, mitochondrial extract was allowed to bind to mitochondrial DNA and Endonuclease G bound DNA was pulled down using Endonuclease G antibody. After the pull down, the extract was loaded into a SDS PAGE with Endonuclease G (lane 3) or IgG antibody (lane 2). For reference, mitochondrial extract was also loaded (lane 4). M is the protein marker. For other details refer main Figure 9. (B) P1 nuclease foot-printing to investigate the binding of Endonuclease G to G-quadruplex forming Region I. Radiolabelled oligomers were incubated with Endonuclease G protein and subjected to P1 nuclease and electrophoresed on 18% denaturing PAGE. In each case, lanes 1, 5, 9, 13, 17, 21 are substrate alone, lanes 2, 6, 10, 14, 18, 22 are Endonuclease G alone. Lanes 3, 7, 11, 15, 19, 23 are P1 nuclease alone treated samples and lanes 4, 8, 12, 16, 20, 24 are Endonuclease G plus P1 nuclease treated samples. C1 is C-strand, G1 is G strand, M1, M2 and M3 are mutants while random sequence (RN) is the oligomer with equal G-C content as G1 in a random manner. 50 ng of purified Endonuclease G and 0.03 U of P1 nuclease was used for the assay.