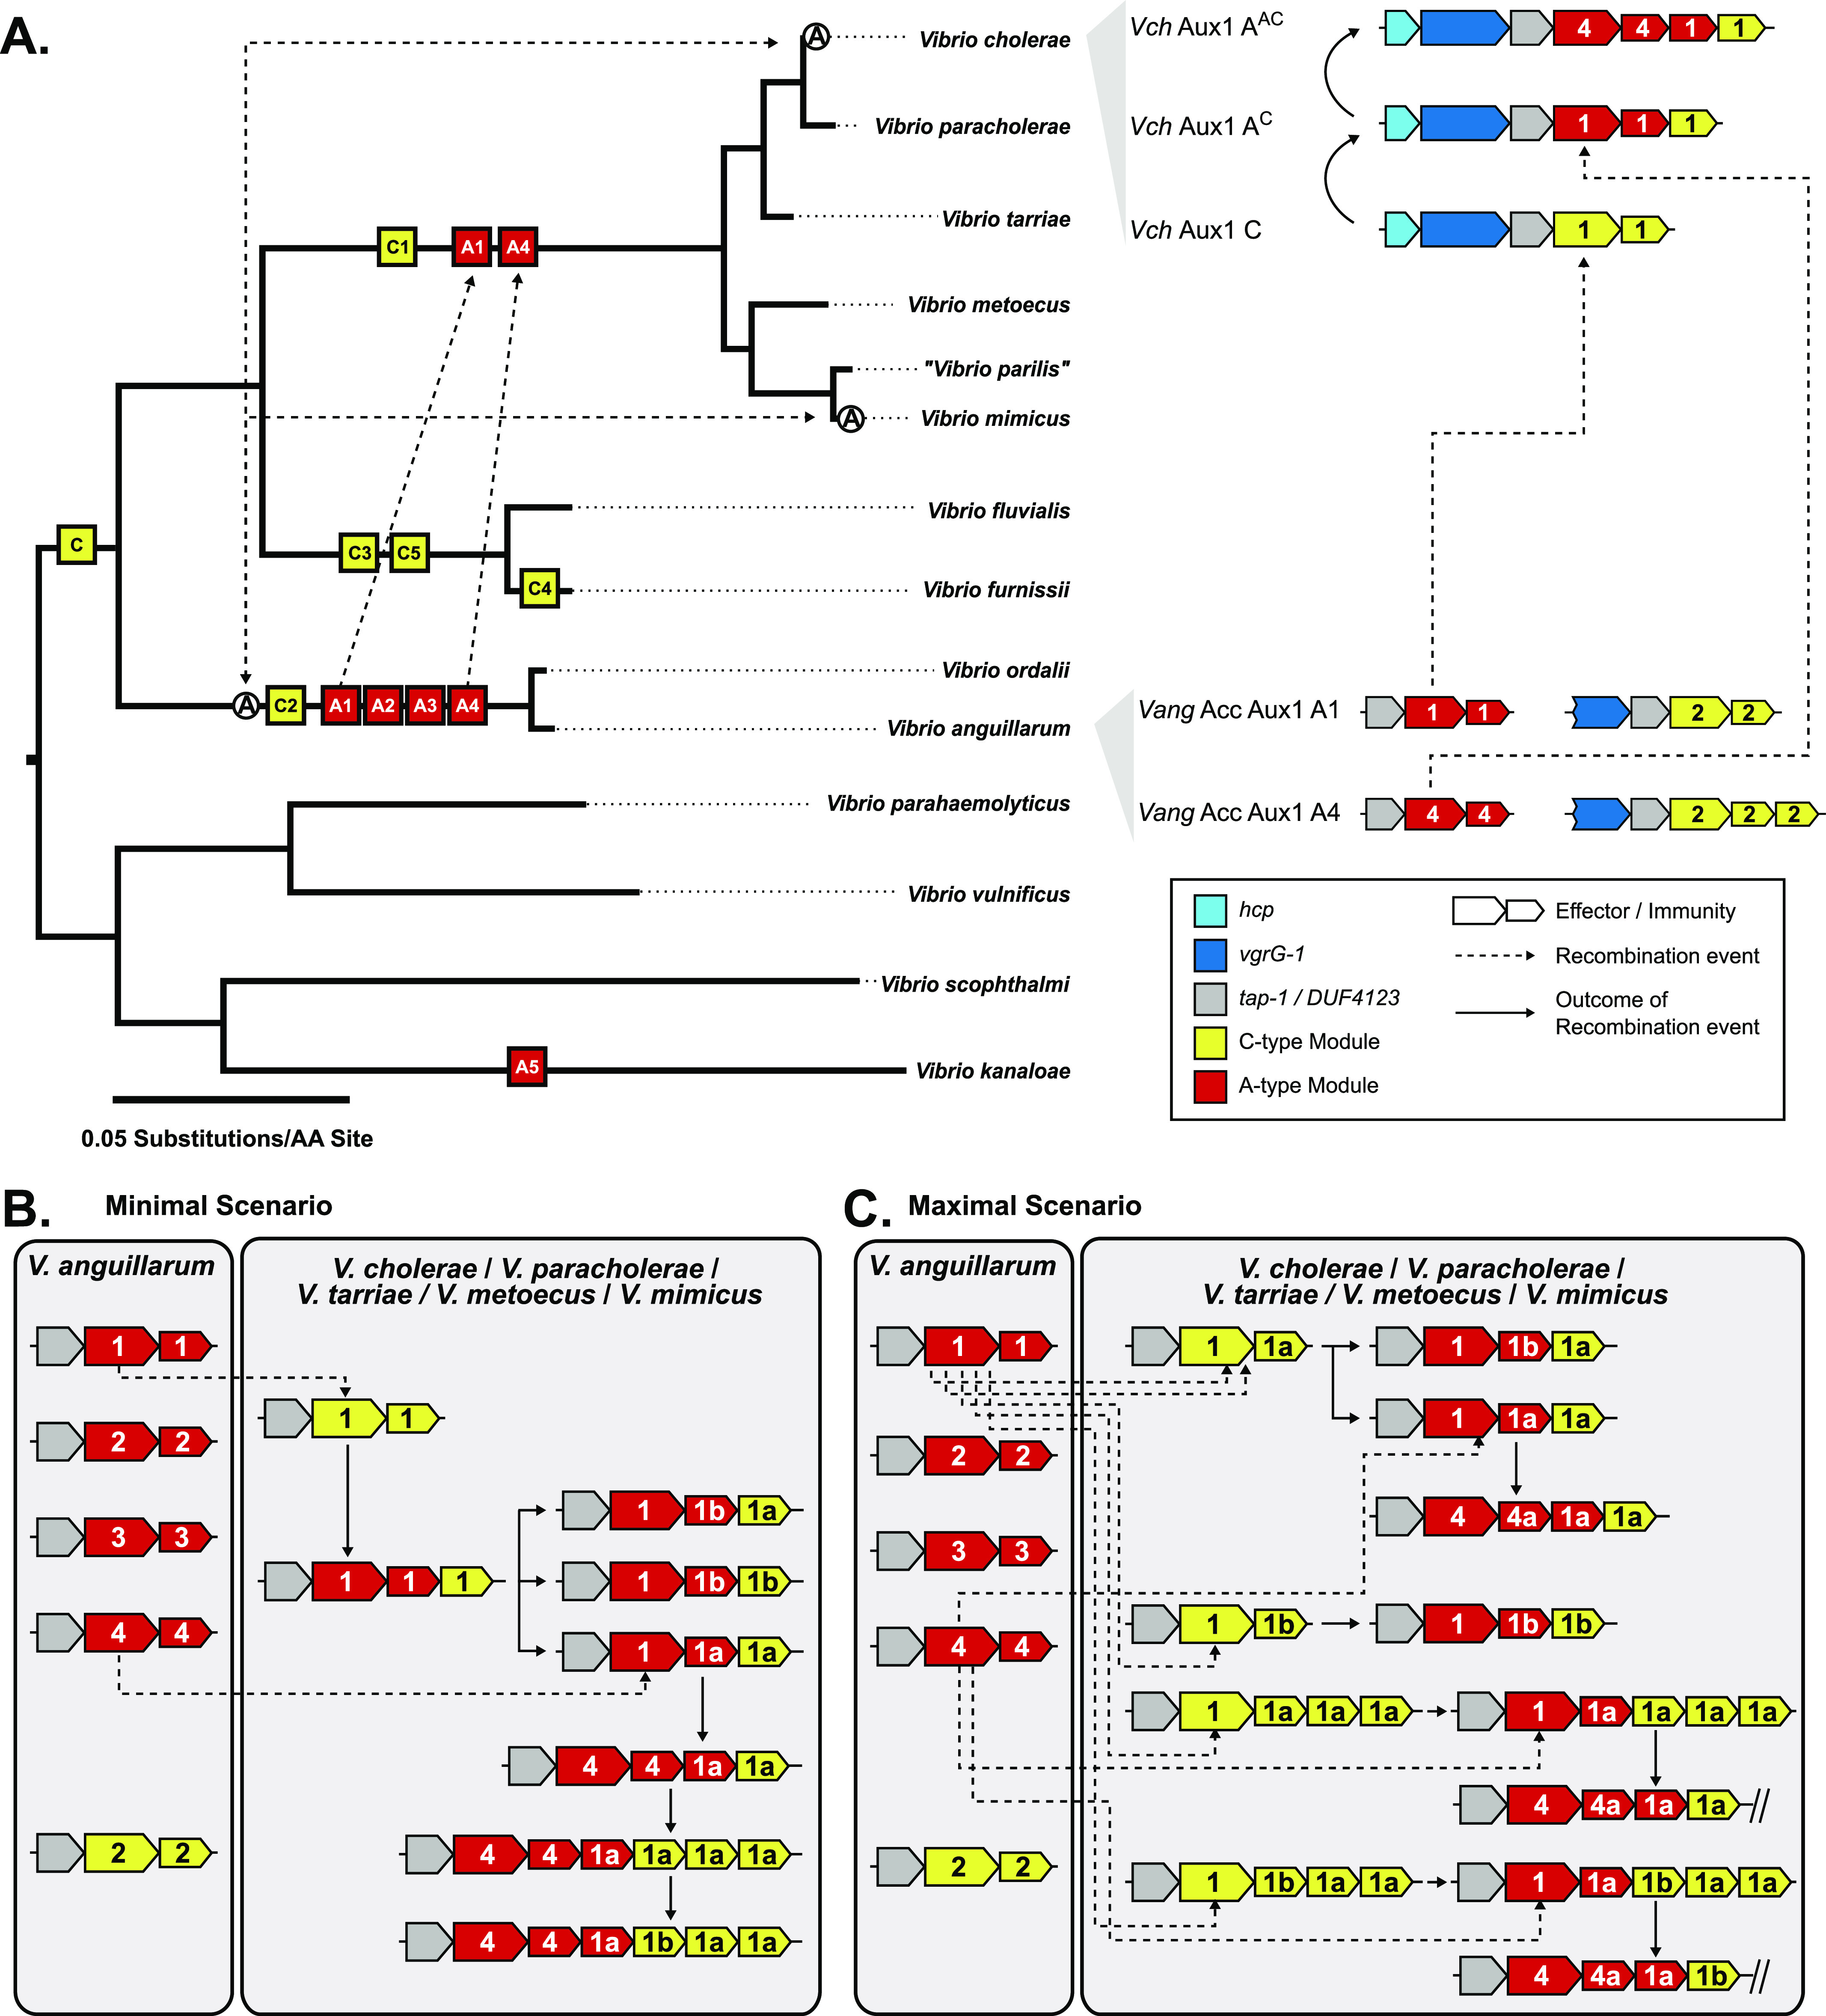
Figure 6. Model of pandemic-associated T6SS effector evolution at the Aux1 cluster of V. cholerae.

(A) Left: Maximum-likelihood tree from Fig 3 overlaid with likely introduction points for each Aux1 effector type and the actin crosslinking domain of vgrG-1. Potential horizontal transfer events are indicated by uni- or bi-directional dashed arrows. Right: Representative genetic diagrams of Aux1 clusters in V. cholerae as well as Acc Aux1 and Aux1 clusters in V. anguillarum. (B, C) Schematic diagrams represent the potential transfer events leading to the array of Aux1 clusters observed in V. cholerae, V. paracholerae, V. tarriae, V. metoecus, and V. mimicus. (B) Minimal gene transfer scenario consisting of Aux1 A1 transfer, the divergence of the recipient cluster, subsequent transfer of Aux1 A4, and further divergence. (C) Maximal gene transfer scenario consisting of multiple individual transfer events for both Aux1 A1 and Aux1 A4. (A, B, C) Effector-immunity types are indicated by color, and effector-immunity subtypes are shown. Dashed arrows indicate recombination events, and solid arrows indicate the resulting cluster from said recombination events.
