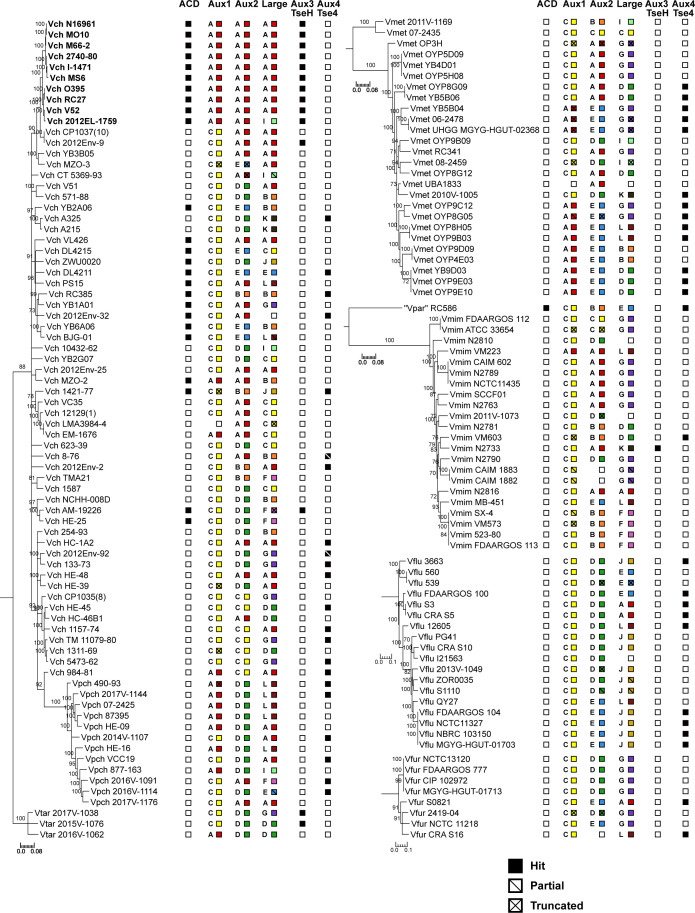
Figure S3. T6SS cluster and effector/immunity type distribution across Vch, Vpch, Vtar, Vmet, “Vpar”, Vmim, Vflu, and Vfur strains.
Species trees for Vch, Vpch, Vtar, Vmet, “Vpar”, Vmim, Vflu, and Vfur. One maximum-likelihood tree based on core-genome SNP sites for each species or group of species. Bootstrapping support values are shown next to corresponding nodes. All nodes with bootstrapping support values below 70 are collapsed. Columns next to trees represent T6SS effectors at different clusters from the Vch population. Filled boxes represent presence. Empty boxes represent absence. Slashes indicate partial or truncated hits. Both letter and corresponding color (Fig 1B) of the present effector type are shown for effectors with multiple types. All scale bars represent substitutions/SNP site. Pandemic V. cholerae strains are shown in bold.

