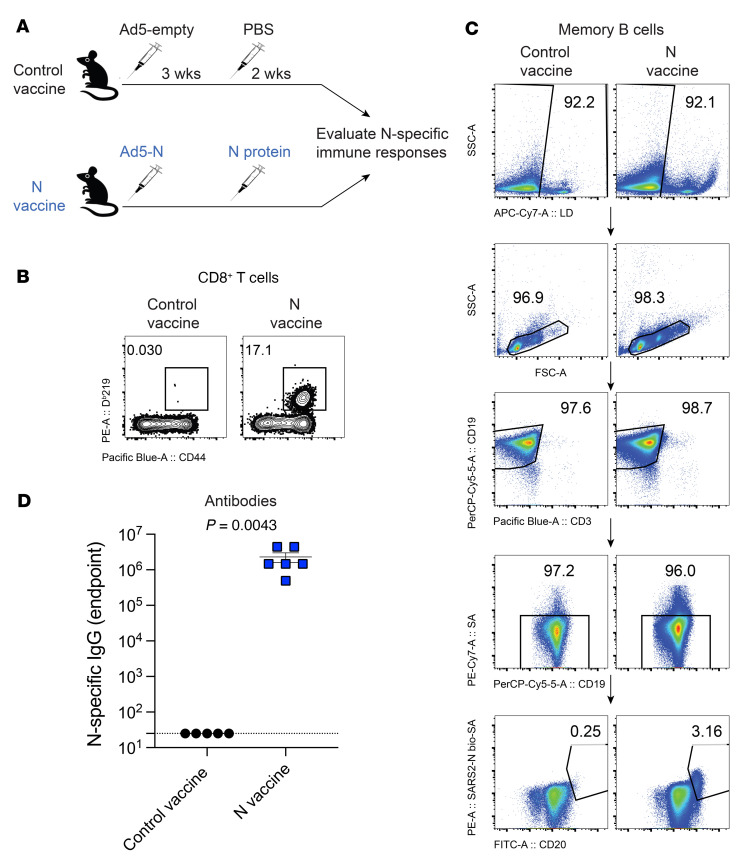
Figure 3. Immunogenicity of a SARS-CoV-2 nucleocapsid vaccine regimen.
(A) Experimental approach for evaluating immune responses after nucleocapsid vaccination. (B) Representative FACS plots showing the frequencies of SARS-CoV-2 nucleocapsid–specific CD8+ T cells (DbN219+) in PBMCs. (C) Representative FACS plots showing the frequencies of SARS-CoV-2 nucleocapsid–specific memory B cells in spleen. Splenocytes were MACS purified by negative selection to enrich for B cells, facilitating the visualization of nucleocapsid-specific B cells. SSC-A, side scatter area. (D) Summary of SARS-CoV-2 nucleocapsid–specific antibodies in sera. Data are from week 2 after the boost and are from 1 experiment. n = 5–6 per group. The experiment was performed twice with similar results. The P value was calculated using a Mann-Whitney U test. Error bar represents the SEM.

