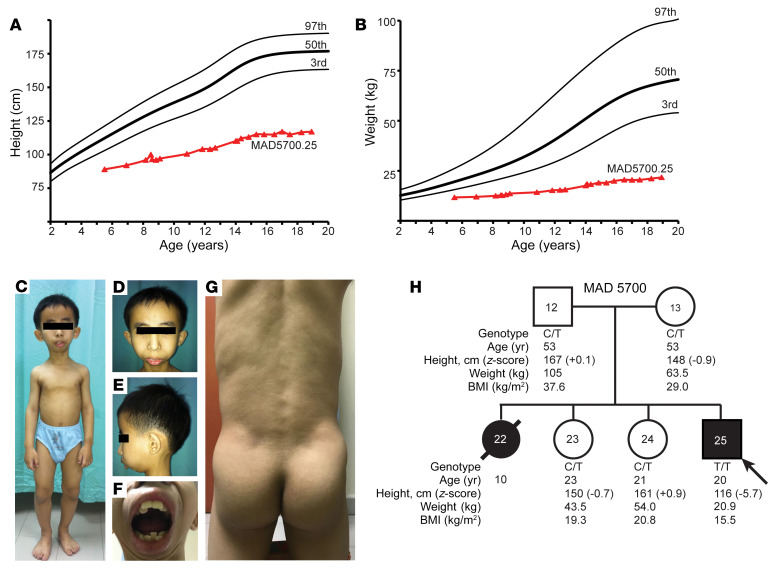
Figure 1. Growth charts, clinical pictures and pedigree of the patient.
(A) Height of proband from age 5–19 years, shown as triangles, compared to normal values shown as the third, fiftieth, and ninety-seventh percentiles. (B) Body weight of proband from age 5–19 years, shown as triangles, compared to normal values from the Centers for Disease Control shown as the third, fiftieth, and ninety-seventh percentiles. (C) Anterior view of the proband at 12 years of age, showing proportionate short stature, small mandible, and muscular extremities. (D) Anterior view of the proband’s face, showing recession of scalp hair from the frontal region and small mandible with protruding maxillary central incisors. (E) Lateral view of the proband’s face, showing marked recession of the chin indicative of mandibular hypoplasia. (F) Anterior view of the proband’s mouth, showing crowding of both the maxillary and mandibular teeth. (G) Posterior view of the trunk and gluteal region of the proband showing marked muscularity and loss of subcutaneous fat indicative of lipodystrophy. (H) MAD 5700 pedigree with genotype and phenotype data. Circles denote females, and squares denote males. Symbols filled with black represent affected individuals with the progeroid syndrome, whereas white symbols indicate unaffected individuals. The number in the center of the symbol indicates pedigree number. Slanted arrow indicates the proband. Diagonal line across the symbol indicates deceased individual. The genotypes, age, height, weight, and body mass index (BMI) of the individuals are given under the symbols. Individuals with heterozygous c.86C>T TOMM7 variant are indicated with “C/T,” and the proband with the homozygous variant is indicated with “T/T.”

