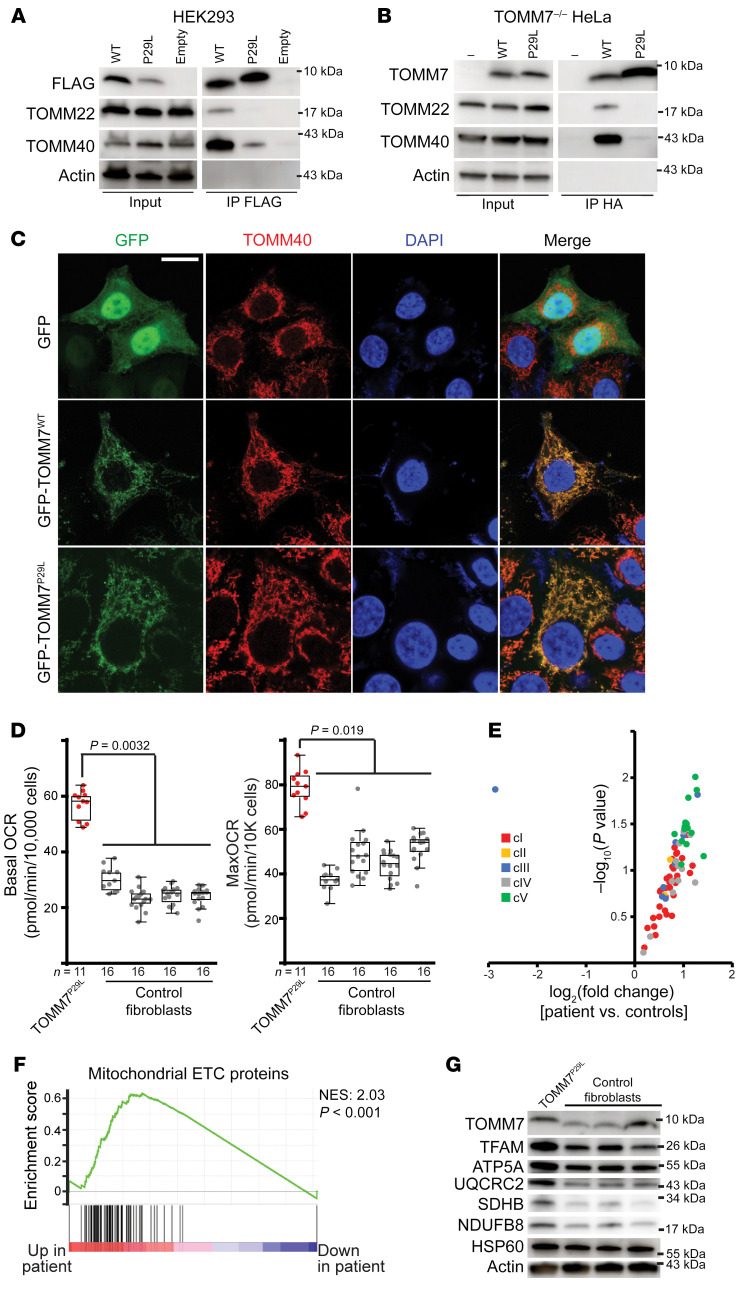
Figure 3. The functional impact of TOMM7 variant, P29L.
(A) Immunoprecipitation of FLAG-TOMM7WT (WT), FLAG-TOMM7P29L (P29L), or empty vector transiently expressed in HEK293 cells, as assessed by Western blot. Input whole cell lysates and immunoprecipitated fractions (IP FLAG) are shown. TOMM7P29L displays decreased interaction with the core TOMM complex (TOMM40 and TOMM22). Molecular weights are indicated. (B) Similar to A, but in Tomm7–/– HeLa cells transduced with TOMM7wt or Tomm7P29L-expressing lentiviral particles. (C) Heterologous expression of TOMM7WT (wildtype) or TOMM7P29L (tagged with GFP [green]) in Tomm7–/– HeLa cells indicates both proteins are localized to mitochondria; mitochondria visualized with anti-TOMM40 (red). (D) Increased basal and maximal (uncoupled) oxygen consumption rates (OCR) measured in proband (TOMM7P29L) and control fibroblast cell lines. n = 11–16 for each cell line. A linear mixed model (GraphPad Prism) was fit to test the difference between proband and control cell lines. Box plots indicate median and interquartile values; whiskers are plotted using the Tukey method. (E) Volcano plot of mitochondrial ETC component protein abundance in proband versus control fibroblasts. Individual proteins are color-coded based on the mitochondrial complex with which they are associated. (F) GSEA of mitochondrial ETC components in proband and control cell lines. The normalized enrichment score (NES) and P value are indicated. (G) Western blot analysis of TOMM7 and candidate mitochondrial ETC proteins in proband and control cell lines. Molecular weights are indicated. Actin and HSP60 levels are shown as loading controls.

