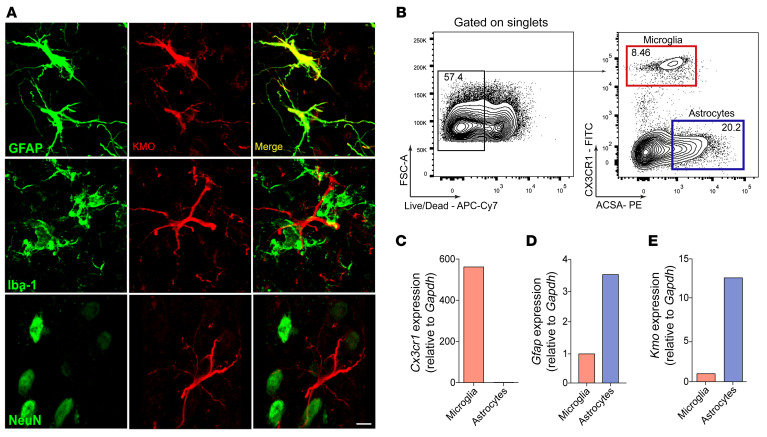
Figure 8. KMO expression cell profile in the spinal cord after SNI.
(A) Representative images showing immunoreactivity for KMO (red color) double labeled with anti-GFAP (astrocytes), anti–IBA-1 (microglia), or anti-NeuN (neurons) in the ipsilateral dorsal horn of the spinal cord from SNI mice (14 days after SNI). Scale bar: 5 μm. (B) Representative FACS strategy for isolating microglial cells (CX3CR1–eGFP+ cells) and astrocytes (ACSA2+) from spinal cord. (C–E) Cx3cr1, Gfap, and Kmo mRNA expression in microglia and astrocytes isolated from the spinal cord (pooled from 8).

