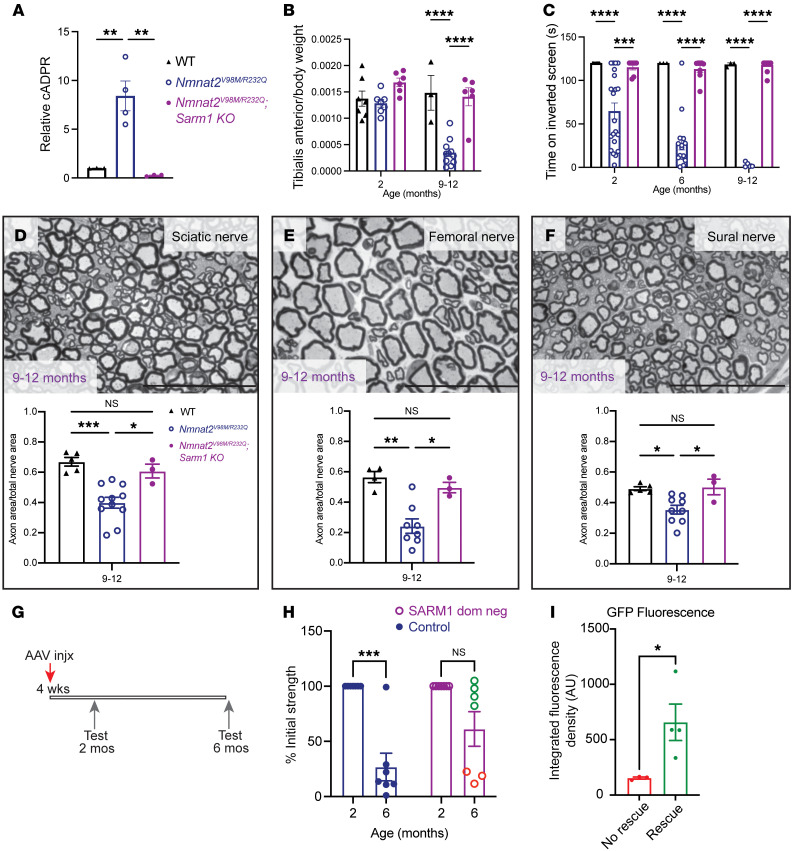
Figure 5. Neuronal SARM1 is required for Nmnat2V98M/R232Q neuropathy.
(A) Relative cADPR levels in sciatic nerves of 2-month-old WT (n = 3), Nmnat2V98M/R232Q (n = 4), and Nmnat2V98M/R232Q; Sarm1-KO (n = 3) mice. Values normalized to WT cADPR levels (set to 1). Statistical significance determined by a Student’s unpaired t test. (B) Average tibialis anterior weight by body weight for WT, Nmnat2V98M/R232Q, and Nmnat2V98M/R232Q; Sarm1-KO mice in 2- and 9–12-month-old mice (n = 3–11 mice per age cohort, per genotype). (C) Average time suspended from an inverted screen (max. 120 seconds) for WT (n = 3–7), Nmnat2V98M/R232Q (n = 3–21), and Nmnat2V98M/R232Q; Sarm1-KO (n = 7–13) mice. (D–F) Representative images of sciatic (D), femoral (E), and sural (F) nerves in 9–12-month-old Nmnat2V98M/R232Q; Sarm1-KO mice. Scale bars: 50 μm. Percent axonal area/total nerve area is calculated below each corresponding nerve (n = 3–11 mice per age cohort, per genotype). Statistical significance was determined by 2-way ANOVA with multiple comparisons. (G) Schematic of AAV-SARM1-DN gene therapy experiment. (H) Percent initial performance on inverted screen test at 2 months and 6 months for EGFP (control) (n = 6) or SARM1-DN–injected (n = 7) Nmnat2V98M/R232Q mice. (I) Quantification of GFP fluorescence in the spinal cord of SARM1-DN injected Nmnat2V98M/R232Q mice, stratified by rescue (Rescue was determined as an endpoint performance (6m) greater than the mean control arm endpoint performance.) All data are presented as mean ± SEM. Statistical significance within treatment group was determined by a Student’s paired, 2-tailed t test. Statistical significance between treatment groups determined by a Student’s unpaired, 2-tailed t test.*P < 0.05, **P < 0.01, ***P < 0.001, ****P < 0.0001.

