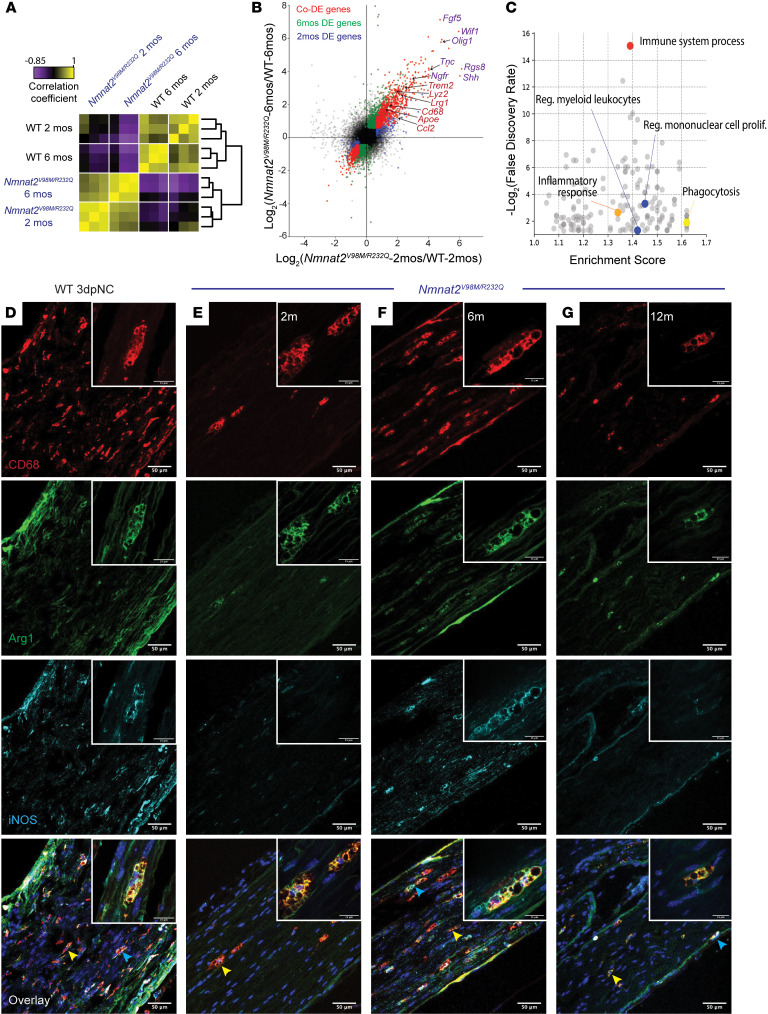
Figure 7. Macrophages are activated throughout disease and express markers of M1 and M2 polarization.
(A) Sample correlation plot showing global transcriptomic analysis and hierarchical clustering of sciatic nerve macrophages from WT and Nmnat2V98M/R232Q mice. Each box represents 1 replicate (n = 3). (B) Volcano plot of significant codifferentially expressed (DE) genes in sciatic nerves of 2 month and 6 month Nmnat2V98M/R232Q old mice, highlighting activated macrophage markers (red) and repair SC signatures (purple). (C) GO analysis of genes enriched in sciatic nerves of 6-month-old Nmnat2V98M/R232Q mice. (D–G) Representative images of CD68, Arg1, and iNOS immunofluorescence in the sciatic nerves of (D) WT mice 3 days after nerve crush (3dpNC) and (E–G) Nmnat2V98M/R232Q sciatic nerves at 2, 6, and 12 months. Scale bars: 50 μm, 15 μm (insets). Yellow arrows indicate Arg1/CD68 colocalization and blue arrows represent Arg1/iNOS/CD68 colocalization. Inset depicts a magnified image of a polarized macrophage. All data are presented as mean ± SEM. Statistical significance determined by 1-way ANOVA with multiple comparisons.

