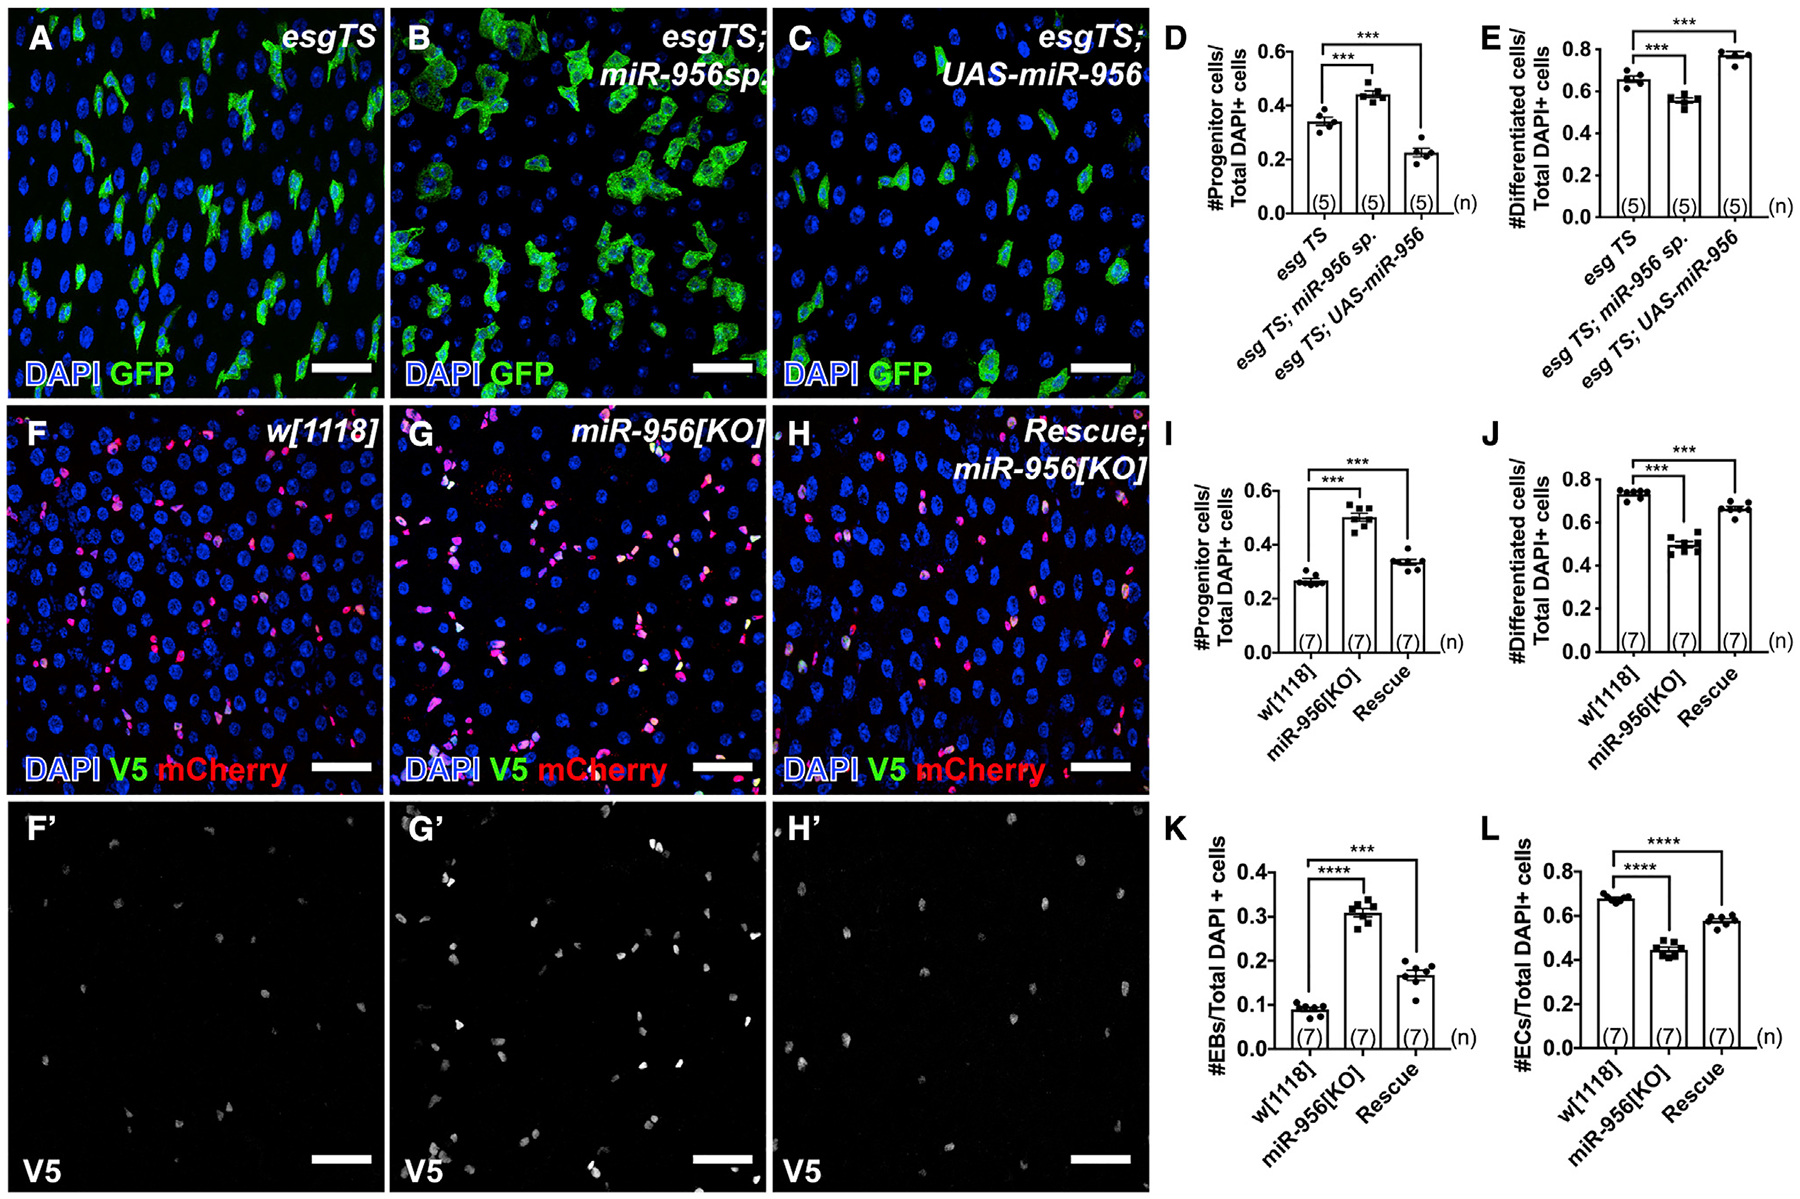
Figure 2. miR-956 balances the proportion of progenitor cells to differentiated cells.

(A–C) esgTS-labeled progenitor cells (green) in (A) esgTS, (B) esgTS; UAS-miR-956sp, and (C) esgTS; UAS-miR-956 midguts counterstained for all cell nuclei (DAPI in blue).
(D) Quantification of progenitor cell numbers in esgTS, esgTS; miR-956sp and esgTS, UAS-miR-956 animals.
(E) Quantification of GFP-negative differentiated cell numbers in esgTS, esgTS; miR-956sp and esgTS; UAS-miR-956 animals.
(F–H) Midguts in (F) wild-type(w[1118]), (G) miR-956[KO], and (H) mutants rescued with miR-956 rescue transgene counterstained for progenitors (anti-mCherry in red), EBs marked using Su(H)-GBE-V5 (anti-V5 in green), and all cell nuclei (DAPI in blue). (F′–H′) Grayscale images of indicated channels from (F)–(H).
(I–L) Quantification of (I) progenitor cells, (J) mCherry-negative differentiated cells, and (K) EB and (L) EC numbers in miR-956[KO] mutants compared with wild type and rescued controls.
Data shown as mean ± SEM. Significance values: ***p < 0.001; ****p < 0.0001. Scale bar, 25 μm. n values in the graphs indicate the number of intestines.
