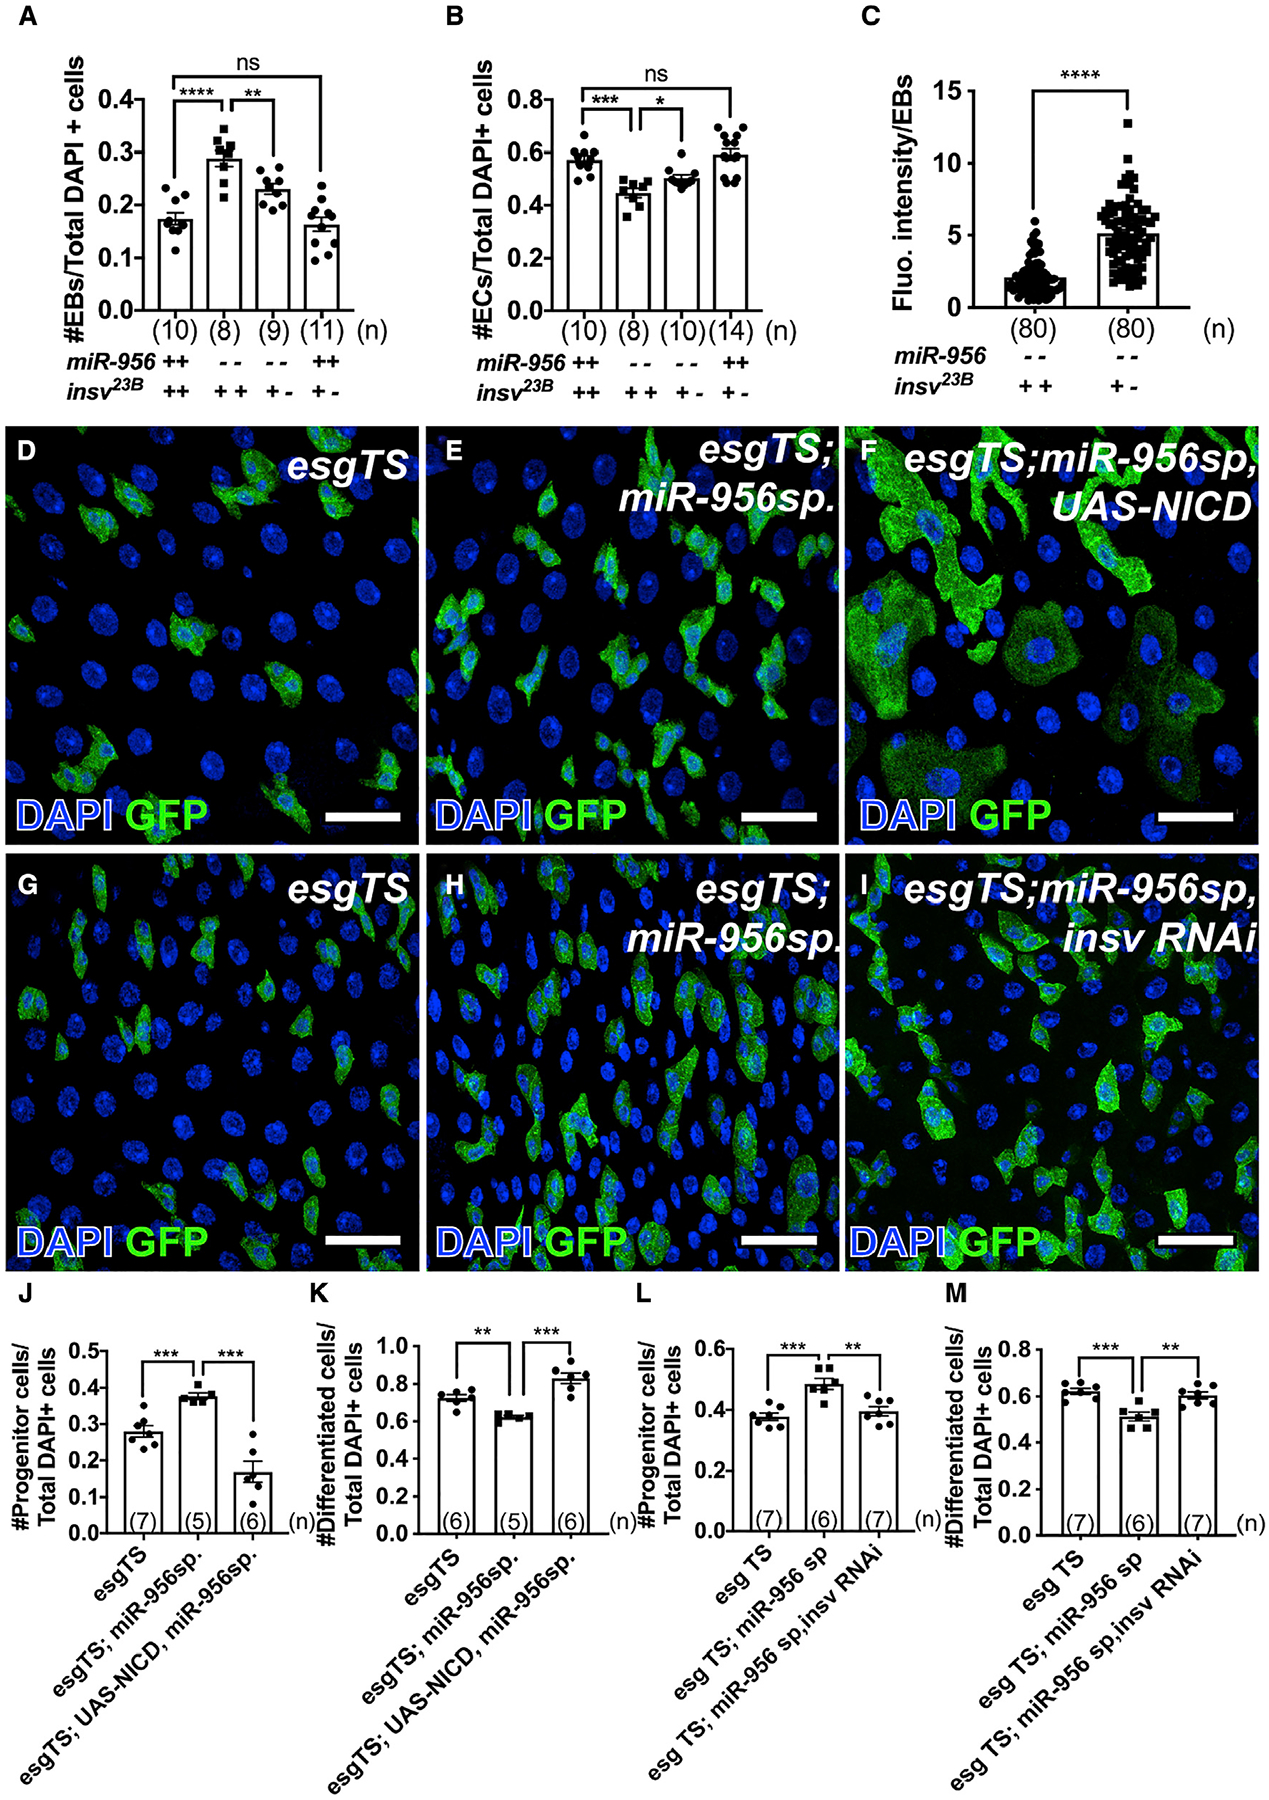
Figure 5. miR-956 promotes EB-to-EC differentiation by regulating the Notch signaling activity.

(A) Quantification of EB numbers in control or miR-956[KO] mutants that harbor two or one wild-type alleles of insv.
(B) Quantification of EC numbers in control or miR-956[KO] mutants that harbor two or one wild-type alleles of insv.
(C) Fluorescence intensity of Notch reporter expression in EBs in miR-956[KO] mutants that harbor two versus one wild-type alleles of insv.
(D–F) esgTS-labeled progenitor cells (green) in (D) esgTS, (E) esgTS; UAS-miR-956sp, and (F) esgTS; UAS-miR-956sp, UAS-NICD midguts counterstained for all cell nuclei (DAPI in blue).
(G–I) esgTS-labeled progenitor cells (green) in (G) esgTS, (H) esgTS; UAS-miR-956sp, and (I) esgTS; UAS-miR-956sp, insv RNAi midguts counterstained for all cell nuclei (DAPI in blue).
(J and K) Quantification of (J) progenitor cell numbers and (K) GFP-negative differentiated cell numbers in esgTS, esgTS, UAS-miR-956sp and esgTS, UAS-miR-956sp, UAS-NICD animals.
(L and M) Quantification of (L) progenitor cell numbers and (M) GFP-negative differentiated cell numbers in esgTS, esgTS, UAS-miR-956sp and esgTS, UAS-miR-956sp, insv RNAi animals.
Data shown as mean ± SEM. Significance values: n.s., not significant; *p < 0.1; **p < 0.01; ***p < 0.001; ****p < 0.0001. Scale bar, 25 mm. n values in the graphs indicate the number of intestines.
