
Fig. 1 |. Mental health symptom scores before and during the first COVID-19 pandemic year in Dutch people with or without lifetime depressive and/or anxiety disorders.
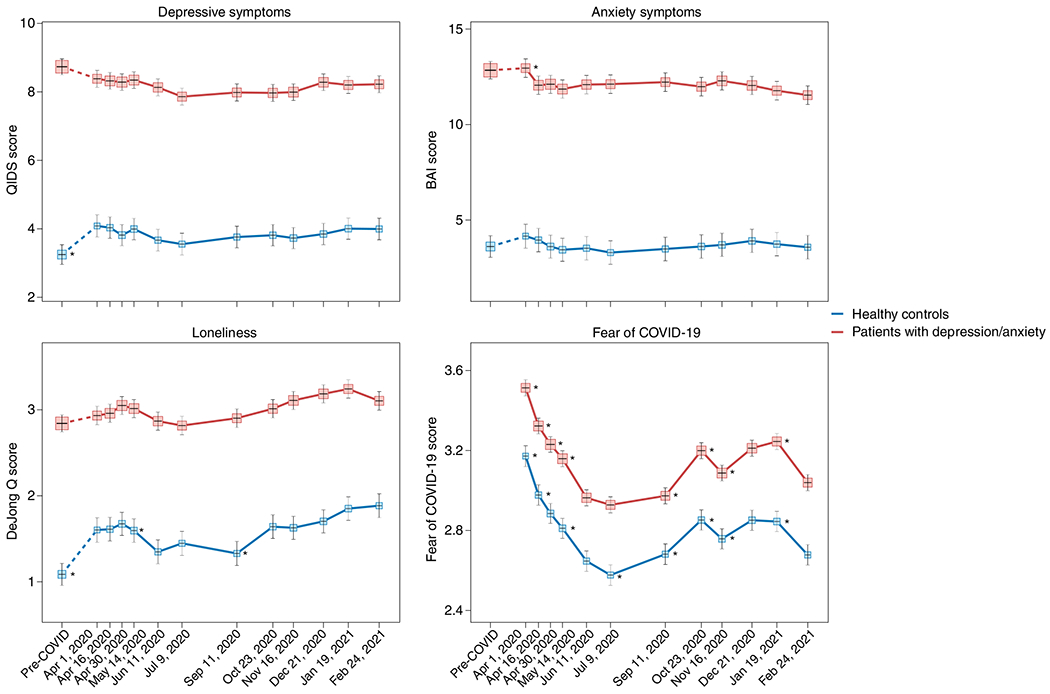
Trajectories of mean depressive symptoms (QIDS score), anxiety symptoms (BAI score), loneliness (De Jong questionnaire score) and Fear of COVID-19 score before and during the first year of the COVID-19 pandemic in healthy controls (blue line, n = 378) and in patients with depressive and/or anxiety disorders (red line, n = 908). The x-axis indicates time with one pre-COVID assessment (averaged over up to five earlier assessments conducted between 2006 and 2019) and 11 online assessments during April 2020 through February 2021. Symbols indicate the mean score during the assessment with 95% CIs. As compared to pre-COVID assessment scores, the figure shows a statistically significant increase of depression and loneliness symptoms during the first pandemic peak (April 2020) in healthy controls but not in patients (for more details, see refs. 22,54). Asterisks indicate where subsequent wave scores differ from the prior wave scores (P < 0.05). The figure also illustrates the stability of depressive and anxiety symptoms during the first COVID year, a significant increase in loneliness during this period and fluctuations of Fear of COVID-19 score that positively correlate with infection rates in the Netherlands. Raw data are from the Netherlands Study of Depression and Anxiety (NESDA), which were re-analyzed for the current plots to illustrate differences between two groups (healthy controls versus patients). BAI, Beck Anxiety Inventory; QIDS, Quick Inventory of Depressive Symptoms.