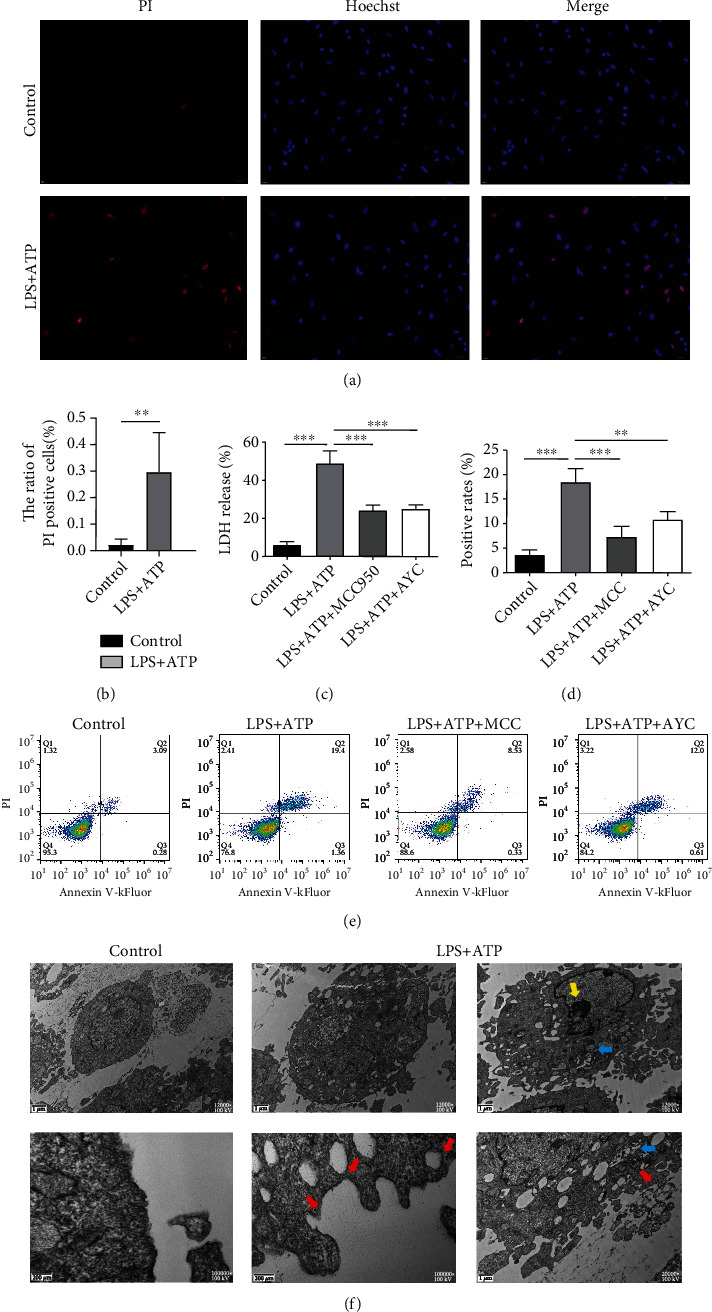
Figure 6.

Detection of pyroptosis in fibroblast-like synovial cells of coculture system. Cocultured FLS cells were challenged with LPS for 12 h and ATP for 2 h. Cell exposed to saline was as the control group. The MCC950 group and Ac-YVAD-cmk group were simultaneously added inhibitors to FLS cells. (a) PI- and Hoechst 33342-stained FLS cells in the control and LPS+ATP groups. (b) Quantification of PI-positive cells. Independent samples t-test. (c) The release of LDH was measured among the control, LPS+ATP, LPS+ATP+MCC950, and LPS+ATP+AYC groups. (d, e) Cells double stained by PI and kFluor488 for flow cytometry. One-way ANOVA followed by Bonferroni's post hoc test was used. ∗P < 0.05, ∗∗P < 0.01, and ∗∗∗P < 0.001. (f) Representative transmission electron micrographs of FLS cells. Compared with control group, FLS cells exhibited pyroptotic features: extensive membrane bubbles and pores (red arrow); chromatin margination and condensation (yellow arrow); and swollen mitochondria with collapsed cristae (blue arrow).
