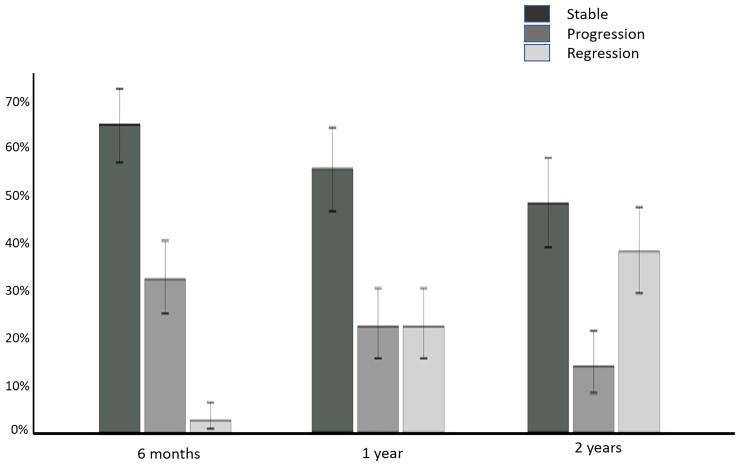
Figure 3.
Bar chart with 95% confidence intervals, representing the proportion of patients with each grade of cardiovascular magnetic resonance response to chemotherapy at each time points studied (6 months, 1 year, and 2 years). Amyloid progression defined as ≥5% increase in extracellular volume, stable amyloid load defined as <5% change in extracellular volume and amyloid regression defined as ≥5% decrease in extracellular volume.

