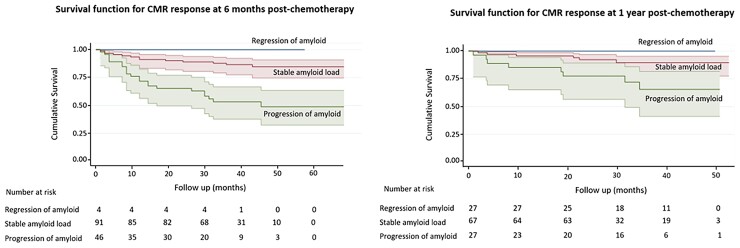
Figure 5.
Kaplan–Meier survival curves, with shaded 95% confidence regions, displaying survival in all patients according to change in amyloid burden (measured by the change in extracellular volume on follow-up cardiovascular magnetic resonance) after 6 months (left panel) and 1 year of chemotherapy (right panel).

