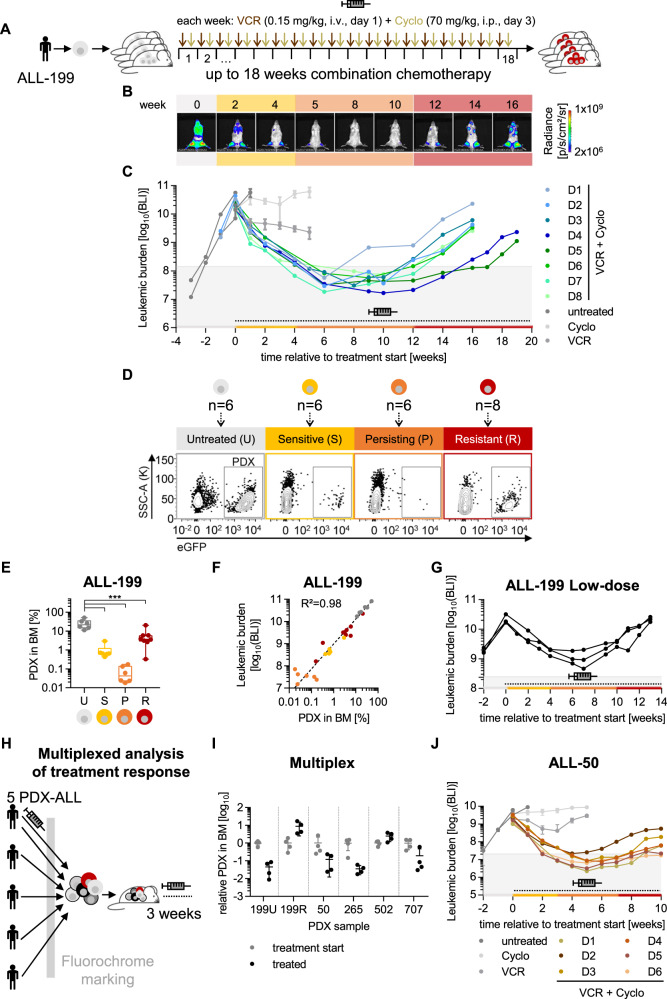
Fig. 1. An in vivo model of acquired resistance in PDX ALL.
ALL-199 PDX acquire resistance during long-term treatment in vivo. A Experimental procedure; PDX ALL-199 cells expressing luciferase were engrafted into 40 mice and in vivo bioluminescence imaging was performed repetitively in each mouse. At high leukemic burden, n = 6 mice were sacrificed (time point untreated (U), grey). Remaining mice received weekly injections of either VCR (0.15 mg/kg, i.v.) or Cyclo (70 mg/kg, i.p.) alone (n = 3 for Cyclo or VCR, respectively) or in combination (n = 28, VCR on day 1 and Cyclo on day 3) for a period of up to 18 weeks. Mice were sacrificed and PDX cells isolated from BM at defined time points: 3 weeks after start of treatment (sensitive (S), yellow, n = 6), at minimal residual disease around 10 weeks after start of treatment (persisting (P), orange, n = 3 each week, n = 6 in total) and at the end of the experiment (resistant (R), red, n = 8 in total). Remaining mice (n = 8) were sacrificed due to toxicity/illness throughout the experiment. B Representative imaging pictures of one mouse (D3) monitored over the course of the experiment. Weeks relative to treatment start are shown. Background colours indicate the disease stage as defined in A. C Quantification of bioluminescence imaging (BLI) signals. Mice treated with the combination regimen for up to 18 weeks (n = 8) were classified as resistant derivatives D1-D8, marked by individual colors. For D1-D8, each dot represents one measurement and each line represents one mouse; for untreated (n = 6), Cyclo (n = 3) and VCR (n = 3) groups mean+/− SD is shown, and individual mice are shown in Fig. S1B. Dashed line and the syringe symbol indicate treatment period; grey area indicates tumor burden below 1% relative to start of treatment. D Flow cytometric analysis of PDX cells isolated from BM from one representative mouse at each time point; eGFP marks transgenic ALL-199 cells. E Quantification of PDX cells in BM from all mice was measured as in Fig. 1D and is depicted as a boxplot with median, 25th, and 75th percentile, and min/max indicated by whiskers; each dot represents one mouse. ***p < 0.001 by one-way ANOVA followed by Tukey’s multiple comparisons test. F Correlation of imaging signals of Figs. 1C and S1B and PDX proportions from Fig. 1E; each dot represents one mouse. Correlation curve and R² were calculated using non-linear regression. G Low dose treatment of ALL-199. Experiment was performed as in Fig. 1A except that lower doses of chemotherapy were used (0.1 mg/kg VCR, 50 mg/kg Cyclo). Imaging signals were quantified and are depicted as in Fig. 1C (n = 3). Multiplexed analysis of treatment response of 5 PDX ALL models transplanted into the same mouse. H Experimental procedure. 4 untreated PDX ALL samples (ALL-50, ALL-265, ALL-502, ALL-707) together with untreated ALL-199U and resistant ALL-199R (from Fig. 1D) expressing individual fluorochrome markers were mixed and injected into groups of mice. After 4 weeks of in vivo growth, control mice were sacrificed (treatment start, n = 4), and remaining mice received either the combination chemotherapy applied in Fig. 1A–F (treated, n = 4, 0.15 mg/kg VCR and 70 mg/kg Cyclo) or solvent (PBS, n = 4) for 3 weeks. I Fluorochrome expression was analyzed for each mouse by flow cytometry. Individual PDX samples were identified and quantified based on the recombinant molecular markers. Proportion of each PDX sample at the end of treatment was normalized to the mean proportion of the respective sample within the mix at treatment start. Values below 100 upon treatment indicate that the sample responds to treatment; one dot represents the PDX population of one PDX ALL sample within one mouse. J ALL-50 PDX acquire resistance during long-term treatment in vivo. Experiment was performed as in Fig. 1A and depicted as in Fig. 1C, except that ALL-50 transgenic for luciferase/mCherry and a genetic barcode were used and mice were treated with adjusted dosing of 0.25 mg/kg VCR and 70 mg/kg Cyclo. Mice were treated with PBS (n = 6), VCR (n = 3), Cyclo (n = 3) or the combination (n = 20). Each color marks 1 resistant derivative D1-D6; for D1-D6, each dot represents one measurement and each line represents one mouse; additional data are shown in Fig. S1F–H.

