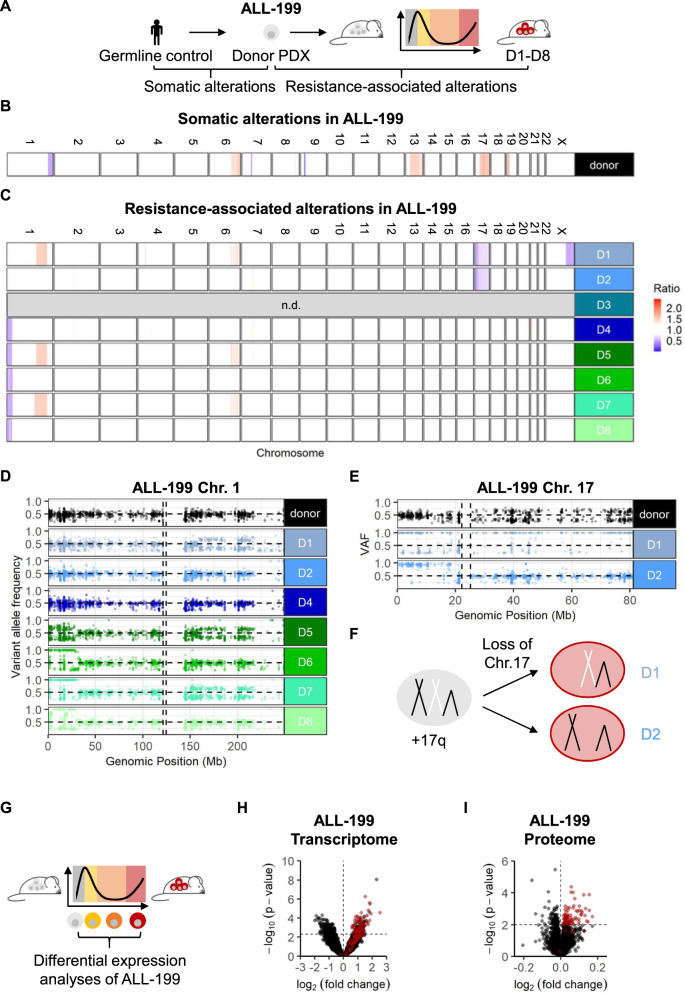
Fig. 3. Heterogeneous genomic alterations, but shared expression features upon acquired resistance in ALL-199.
Genomic characterization of resistant ALL-199 derivatives A Whole exome sequencing was performed on ALL-199 germ line control obtained from healthy BM cells of the patient, donor PDX model, untreated cells and the eight resistant derivatives (D1-D8). Comparison between donor ALL-199 PDX and germline control to identify somatic alterations of the PDX leukemia (B); comparison between resistant D1-D8 and donor PDX to identify resistance-associated alterations (C); losses are depicted in blue and gains in red. Each row depicts one chromosome and each line depicts one sample. D3 was excluded due to poor sequencing quality. Magnification into chr. 1 (D) and chr. 17 (E); each dot represents a SNV as determined using hg19 as reference; homozygous SNV (VAF > 0.8) present in the donor sample and SNV with VAF < 0.2 were excluded. Horizontal dashed line represents VAF = 0.5, vertical dashed lines represent centromere positions. F Schematic representation of chr. 17 in donor PDX ALL-199 (light grey), where one allele of chr. 17q is duplicated, and in resistant derivatives D1 and D2 (red), where one of two whole chr. 17 alleles were lost. G-I Transcriptomic and proteomic profiling G Experimental layout: Transcriptomes were determined from ALL-199U (n = 5), ALL-199S (n = 6), ALL-199P (n = 5) and ALL-199R (n = 24, combined samples shown in Figs. 1C, 2D, S2I). Proteomes of ALL-199U (n = 4) and ALL-199R (n = 8) were analyzed. H Volcano plot representing genes differentially expressed between ALL-199U and ALL-199R; each dot represents one transcript; dashed lines indicate cut-offs for significant up- or downregulation (p < 0.005 and log2 fold-change >0 or <0, respectively). Red dots indicate candidates, which were chosen for further analysis. I Volcano plot of all differentially expressed proteins between ALL-199U and ALL-199R is shown and depicted as in Fig. 3H; dashed lines indicate cut-offs for significant up- or downregulation (p < 0.01 and log2 fold-change >0 or <0, respectively).

