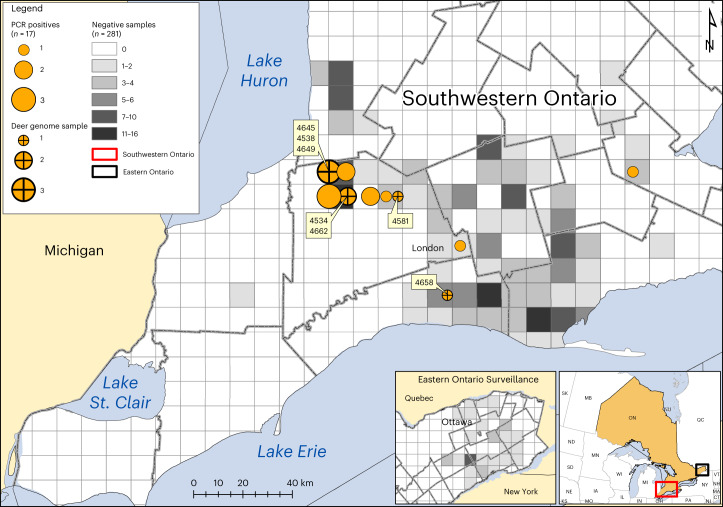
Fig. 1. SARS-CoV-2 in white-tailed deer sampled in Ontario, 2021.
Circle size indicates the relative number of positive white-tailed deer (n = 17/298), with crosses showing samples from which viral genomes were recovered (n = 7). Four-digit genomic sequence ID labels are shown in yellow boxes. Location of negative samples are indicated using grey as per the legend. The detailed map depicts Southwestern Ontario (red rectangle on inset map). SARS-CoV-2 RNA was not detected in samples from Eastern Ontario.

