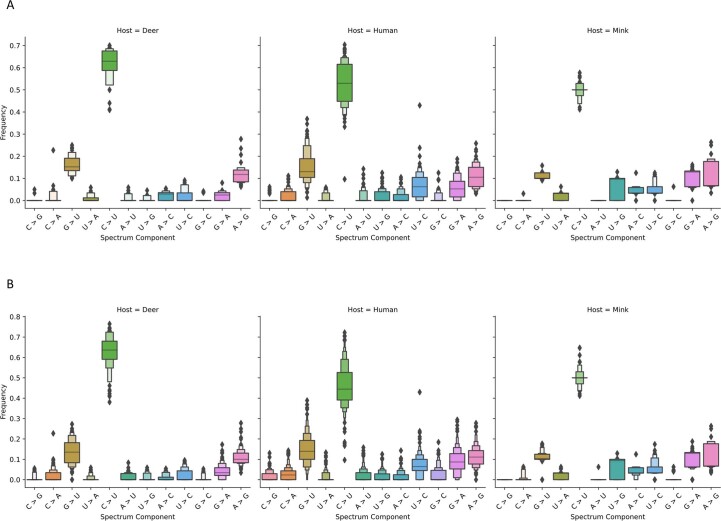
Extended Data Fig. 3. Comparing mutational spectra among hosts.
Boxen plots illustrating differences in the mutational spectra among hosts when considering only (a) clade 20 C (ndeer = 42, nmink = 91, nhuman = 108) and (b) all clades (ndeer = 105, nmink = 432, nhuman = 103). These plots show differences in both the frequency and overall distribution of each mutation within each host species. Samples from each host species were isolated from individuals in North America. The measure of center for each plot is the 50th percentile. The first boxes above and below the 50th percentile represent 50% of the data and each additional box accounts for one-quarter of the remaining data. The total number of boxes and outliers (diamonds) are determined using Tukey’s method.

