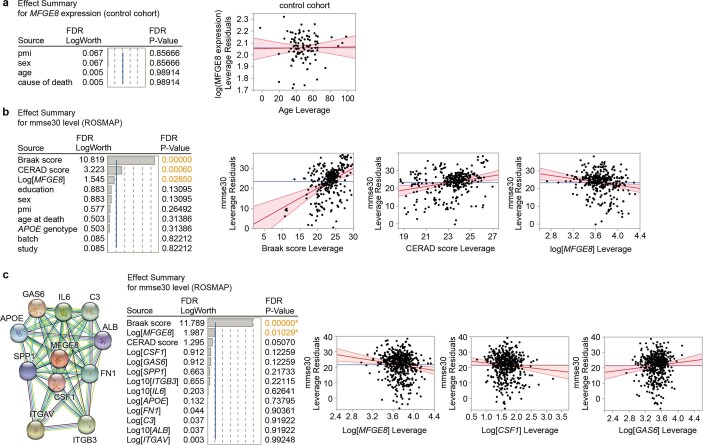
Extended Data Fig. 8. The impact of MFGE8 gene expression on measures of cognitive decline in AD patients.
Linear regressions (Standard Least Squares) were performed to analyse a, the impact of ageing on MFGE8 gene expression in a control cohort of 116 patients who died without dementia, and b, the impact of MFGE8 gene expression on cognitive performance (‘mmse30’) adjusted for Aβ plaque load (‘CERAD score’), tau pathology (Braak and Braak: ‘Braak score’), education level, post-mortem interval (‘pmi’), sex, age at death, APOE genotype, RNA-sequencing batch (‘batch’) as well as the study (ROS vs. MAP) for the data from 566 ROSMAP patients analysed in Fig. 2h. c, The impact of gene expression levels of MFGE8 and 10 genes within its known molecular network (https://string-db.org/) on cognitive performance (‘mmse30’) was analysed in the same patients as in b, adjusted for Aβ plaque load (‘CERAD score’) and tau pathology (‘Braak score’). Selected regression plots are shown as so-called residual vs. leverage plots (see Methods for details): crossing of a least squares line (red) and 95% confidence bands (shaded red) through the mean of the Y leverage residuals (blue line) indicates statistical significance. FDR: False Discovery Rate (adjusted P-value using the Benjamini-Hochberg correction). FDR LogWorth: -log10(FDR P-Value) for each model effect.

