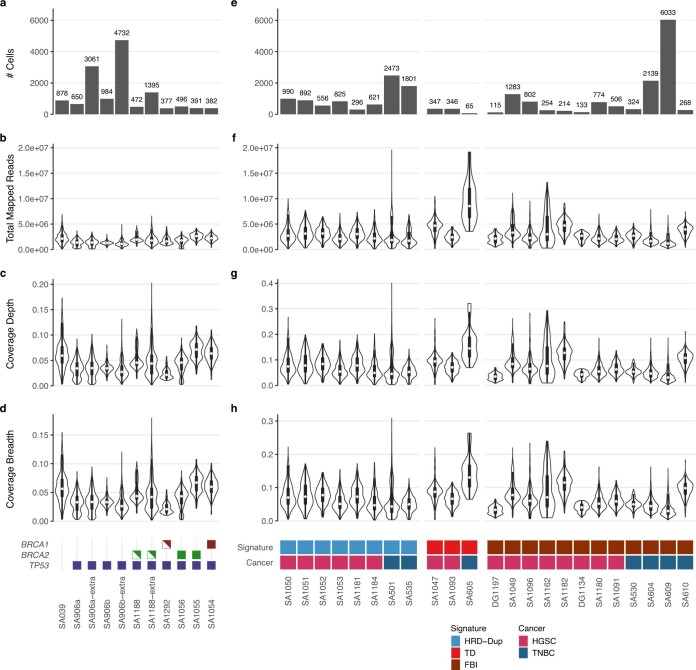
Extended Data Fig. 4. DLP summary statistics.
Summary of DLP+ sequencing statistics of data for 184-hTERT cell lines a–d) and HGSC and TNBC tumours e–h). Number of cells for each box plot as indicated in panels a) and e). Shared y axis labels shown at left. The legend for e–h) indicates the number of samples for each cancer and signature type. All box plots indicate the median, 1st and 3rd quartiles (hinges), and the most extreme data points no farther than 1.5x the IQR from the hinge (whiskers).

