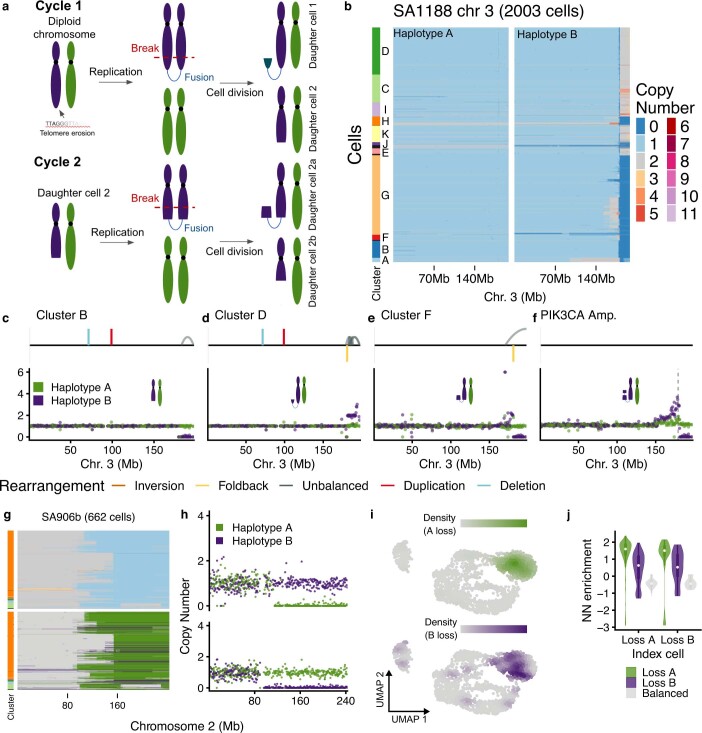
Extended Data Fig. 5. Haplotype-specific analysis reveals breakage–fusion–bridge processes and parallel losses.
a) Diagram of BFBCs b) Heat maps of the copy number of each homologue in SA1188. c–f) HSCN and structural variation in clusters B, I, F and the small subpopulation with PIK3CA amplification. Here we plot the copy number for each homologous chromosome in purple for homologue B and green for homologue A. g) Parallel copy number losses in SA906b: total copy number (top) and HSCN (bottom) heat maps for chr2 in SA906b h) two individual cells from g). i) UMAP dimensionality reduction plots of scRNA-seq data generated from SA906b, colours indicate the density of loss of chr 2q A vs. B haplotype. j) Enrichment of the haplotype-specific state on chr 2q of nearest neighbour cells (# cells with loss of A = 175, # of cells with loss of B = 34, # Balanced = 2066). All box plots indicate the median, 1st and 3rd quartiles (hinges), and the most extreme data points no farther than 1.5x the IQR from the hinge (whiskers).

