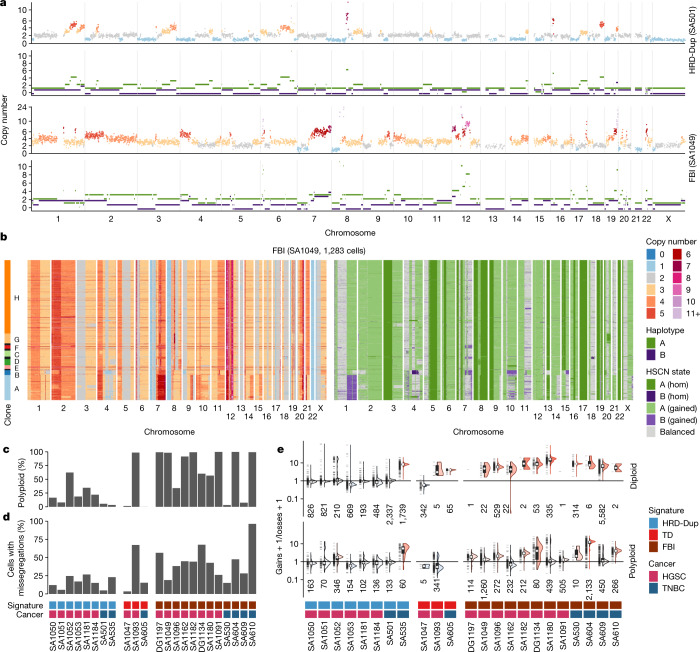
Fig. 3. Single-cell genome properties of PDX models and patient tissues.
a, Total copy number (top) and HSCN (bottom) profiles for two single cells from a case of TNBC HRD-Dup (SA501) and a case of HGSC FBI (SA1049). b, Total copy number heat map (left) and HSCN heat map (right) for 1,283 cells from SA1049. c,d, Proportion of polyploid cells (c) and cells with missegregation events (d). e, Ratio of chromosomal gains versus losses across different ploidy states and mutational signature groupings (number of cells shown below each violin plot). All box plots indicate the median, first and third quartiles (hinges), and the most extreme data points no farther than 1.5× the IQR from the hinge (whiskers).

