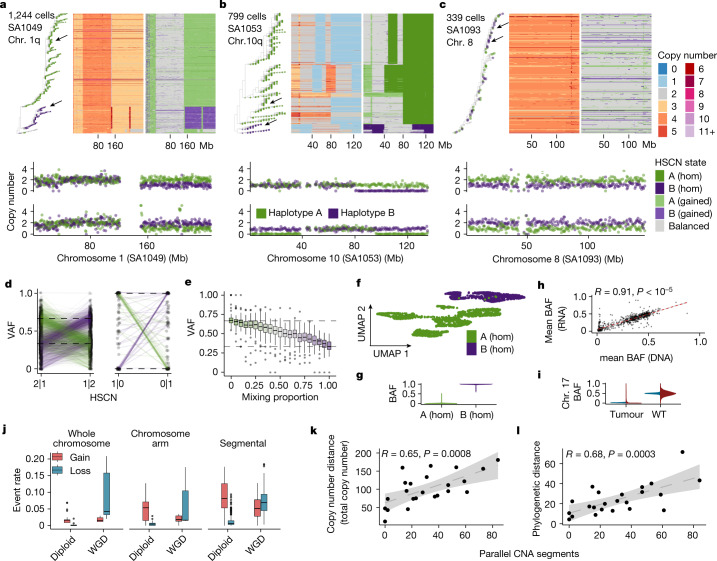
Fig. 5. Haplotype-specific parallel copy number evolution.
a–c, Heat maps of chromosomes 1q (a), 10q (b) and 8 (c) ordered by a phylogenetic tree. The tips of the phylogeny are coloured according to the allelic phase of the region of interest. Arrows indicate single cells, the copy number profiles of which are shown below each heat map. d, VAFs of SNVs in parallel copy number events in two haplotype-specific states in which the dominant allele switches between the two states. Each point is the VAF of a single SNV; lines connect the same SNV in the two states. Dashed lines indicate the expected VAF on the basis of the states. e, VAF of mutations (n = 66) present clonally on allele A after computationally mixing data from SA535 chr. 8 in cells with copy number 2|1 and 1|2. Mixing proportion = 0 means that all cells are in state 2|1 and mixing proportion = 1 means that all cells are in state 1|2. f, UMAP of scRNA-seq data from SA1053 coloured by allelic state of genes at the terminal end of chromosome 10. A (hom), n = 1,614 cells; B (hom), n = 890 cells. g, BAF (B-allele frequency) distribution of cells in f. h, Scatter plot of mean BAF per segment across all datasets (n = 828) computed in RNA versus DNA. i, BAF distribution on chromosome 17 in all tumours and cell lines with matched scRNA (n = 21,347 cells DNA; n = 70,553 cells RNA) versus wild-type cell line (n = 1,963 cells DNA; n = 5,752 cells RNA). j, Rate of gains and losses within whole chromosomes (n = 35 events), chromosome arms (n = 31 events) and segments (n = 341 events) on diploid (1|1) and tetraploid (2|2) backgrounds. WGD, whole-genome duplication. k,l, Correlation of the number of parallel copy number events with copy number distance (P = 0.0008) (k) and phylogenetic distance (P = 0.0003) (l). Annotations at the top indicate the correlation coefficient (R) and P value derived from a linear regression; shaded areas in plots show the 95% confidence interval of the linear regression. All box plots indicate the median, first and third quartiles (hinges), and the most extreme data points no farther than 1.5× the IQR from the hinge (whiskers).

