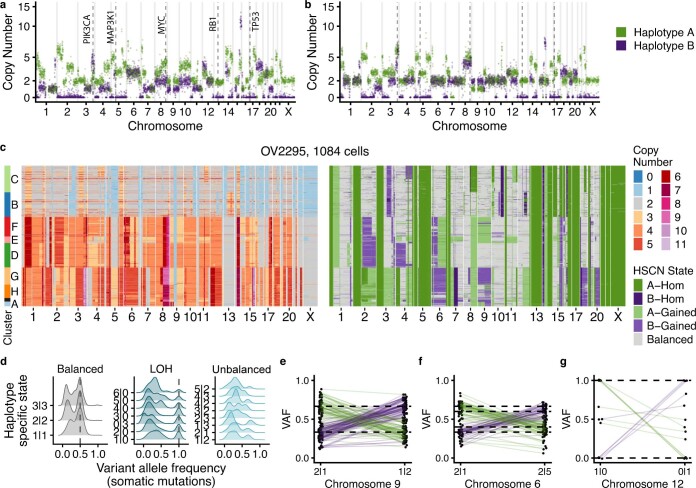
Extended Data Fig. 3. Validation of the SIGNALs method in an ovarian cancer cell line.
a,b) HSCN from 2 individual cells from the OV2295 cell line. c) Total copy number heat maps and HSCN heat map for 1084 cells. Each row is an individual cell. Rows are ordered according to a UMAP + HDBSCAN clustering, with clusters annotated on the left hand side. d) Distribution of VAFs as a function of haplotype-specific state. e,f,g) VAFs in clones where the dominant allele switches between A and B. Each point is the VAF of a mutation, with lines connecting the same mutation in different clones.

